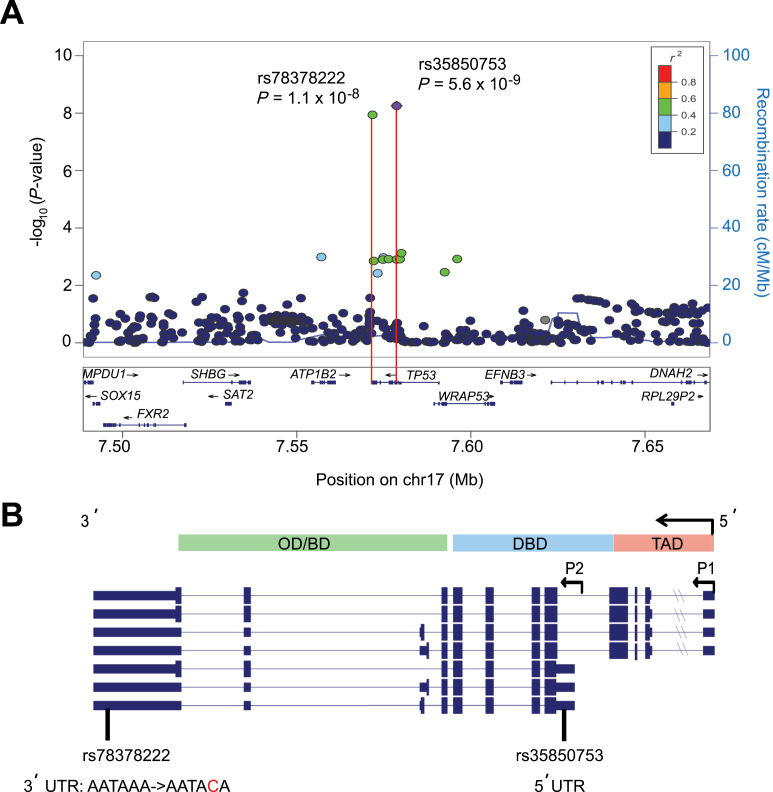
Figure 1.
Discovery of rare variants within TP53 associated with neuroblastoma. A) Regional association plot of genotyped and imputed single nucleotide polymorphisms (SNPs) at the TP53 locus in a discovery cohort of 2101 case patients and 4202 control subjects of European ancestry. Plot was generated using LocusZoom (25). Y-axes represent the statistical significance of association (-log10 transformed P values) and the recombination rate. SNPs are color-coded based on pair-wise linkage disequilibrium (r 2) with most statistically significant SNP. Most statistically significant SNPs are labeled with P value, and most statistically significant SNP is shown in purple. Allelic P values generated by SNPTEST using score method (two-sided). B) Neuroblastoma-associated SNPs map to the 3΄ untranslated region (UTR) of TP53 and 5΄ UTR of the Δ133 isoform of TP53, respectively. The Δ133 isoform is transcribed by an alternative promoter (P2) and lacks a transactivation domain and part of the DNA binding domain. Shown are known isoforms of TP53 currently reported in the NCBI Reference Sequence database (RefSeq). BD = basic domain; DBD = DNA binding domain; OD = oligomerization domain; TAD = transactivation domain.

