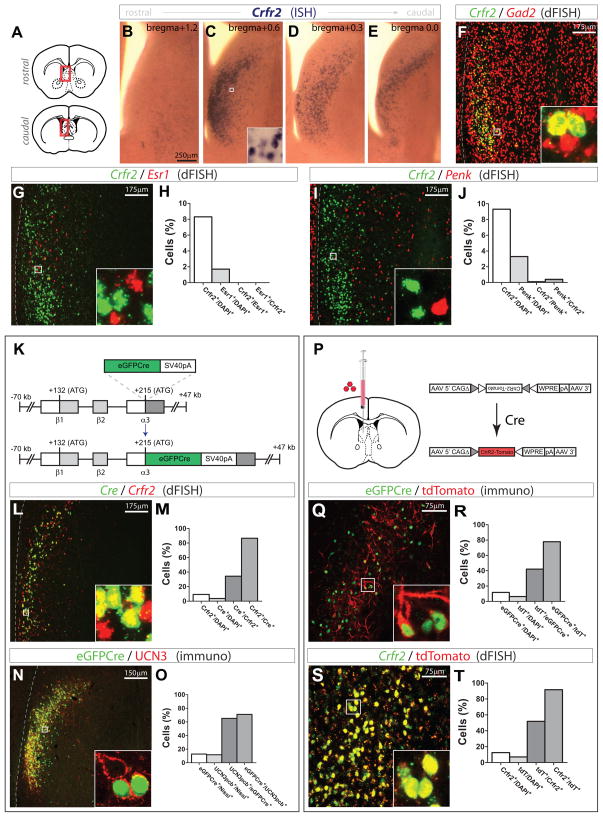
Figure 2. Characterization and transgenic targeting of LS Crfr2α+ neurons.
(A–E) Crfr2 mRNA ISH; coronal diagrams in (A) depict region analyzed.
(F) dFISH for Crfr2 (green) and Gad2 (red).
(G,H) dFISH for Crfr2 (green) vs Esr1 (red): Crfr2+/DAPI+ = 8.3%, Esr1+/DAPI+ = 1.7%, Crfr2+/Esr1+ = 0, Esr1+/Crfr2+ = 0; total n = 11,086 DAPI+ cells
(I,J) dFISH for Crfr2 (green) vs Penk (red): Crfr2+/DAPI+ = 9.3%, Penk+/DAPI+ = 3.3%, Crfr2+/Penk+ = 0.1%, Penk+/Crfr2+ = 0.4%; total n = 8,274 DAPI+ cells
(K) Crfr2α-eGFPCre BAC transgene design.
(L,M) dFISH, Cre mRNA (green) vs. Crfr2 mRNA (red): Crfr2+/DAPI+ = 9.3%, Cre+/DAPI+ = 3.7%, Cre+/Crfr2+ = 34.4%, Crfr2+/Cre+ = 86.6%; total n = 17,537 DAPI+ cells
(N,O) eGFPCre+ nuclei (green) vs. UCN3 pericellular baskets (pcbs; red); counts from areas with detectable transgene expression. UCN3+ pcbs colocalize with synaptophysin (data not shown). eGFPCre+/DAPI+ = 12.8%, UCN3pcb+/DAPI+ = 11.8%, UCN3pcb+/eGFPCre+ = 65.2%, eGFPCre+/UCN3pcb+ = 71.0%; total n = 2,665 Nissl+ cells
(P) Injection site (left) and Cre-dependent AAV (right).
(Q,R) Transgenic eGFPCre+ nuclei (green) vs. recombined, viral tdT (red); counts from areas containing tdT+ cells. eGFPCre+/DAPI+ = 11.7%, tdT+/DAPI+ = 6.3%, tdT+/eGFPCre+ = 42.1%, eGFPCre+/tdT+ = 77.9%; total n = 3,586 DAPI+ cells
(S,T) dFISH for Crfr2 mRNA (green) vs. tdT mRNA (red); counts from areas containing tdT+ cells. Crfr2+/DAPI+ = 12.5%, tdT+/DAPI+ = 7.1%, tdT+/Crfr2+ = 51.9%, Crfr2+/tdT+ = 91.6%; total n = 5,829 DAPI+ cells
In this and subsequent figures, dashed lines at left indicate lateral ventricle (LV), boxed regions shown at higher magnification in insets.
See also Figures S1 and S2.

