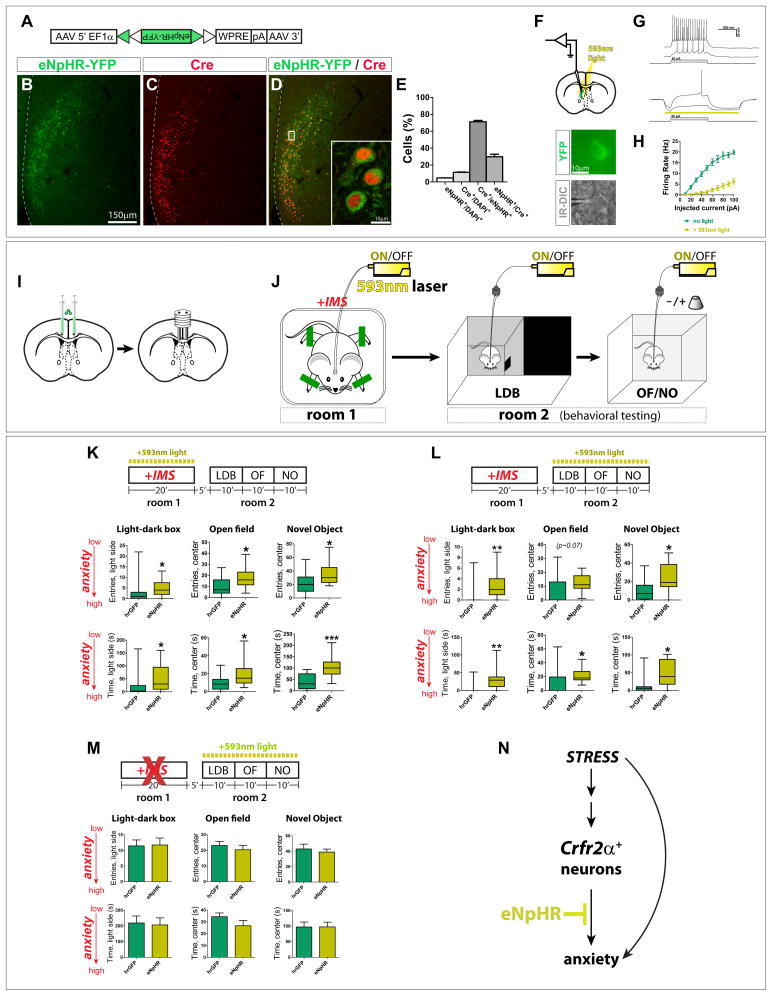
Figure 4. LS Crfr2α+ neurons are necessary for the induction and expression of a stress-induced, anxiogenic state.
(A) Cre-dependent eNpHR(2.0)-YFP AAV.
(B–D) Injection of (A) into Crhr2α-eGFPCre LS yielded eNpHR-YFP (green) in Cre+ cells (red).
(E) Recombination specificity and sensitivity; counts from areas containing eNpHR-YFP+ cells: eNpHR+/DAPI+ = 4.7±0.2%, Cre+/DAPI+ = 11.4±0.4%, Cre+/eNpHR+=71.2±1.6%, eNpHR+/Cre+=29.8±3.0% (mean±s.e.m.). Total n = 8,216 DAPI+ cells from 2 mice.
(F–H) Recordings from eNpHR-YFP+Crfr2α+ neurons. (G) Cell in response to the same current injections in absence (top) or presence (bottom) of 593nm light. (H) 593nm light significantly suppressed firing of eNpHR-YFP+ neurons (F1,108 = 28.69, P<0.001).
(I,J) Surgical manipulations and behavioral testing.
(K) Photoinhibition of Crfr2α+ neurons only during IMS reduced anxiety in subsequent testing. hrGFP (n=15) vs. eNpHR (n=17), data presented Mann-Whitney U value, P value: LDB, entries in light side (U = 64.0, P<0.05), time in light side (U = 62.5, P<0.05); OF, entries in center (U = 69.0, P<0.05), time in center (U = 64.5, P<0.05); NO, entries in center (U = 73.5, P<0.05), time in center (U = 34.0, P<0.001).
(L) IMS mice that received photoinhibition of Crfr2α+ neurons only during behavioral testing showed reduced anxiety relative to controls. hrGFP (n=11) vs. eNpHR (n=11): LDB, entries in light side (U = 21.5, P<0.01), time in light side (U = 20.0, P<0.01); OF, entries in center (U = 25.5, P=0.07), time in center (U = 23.0, P<0.05); NO, entries in center (U = 22.0, P<0.05), time in center (U = 21.0, P<0.05).
(M) Inhibiting Crfr2α+ neurons in the absence of IMS does not alter anxiety. hrGFP(n=11) vs. eNpHR (n=11): LDB, entries in light side (11.5±1.9 vs. 11.7±2.3, P>0.9), time in light side (218.7±44.6 vs. 206.4±45.2, P>0.8); OF, entries in center (23.1±2.6 vs. 20.4±2.8, P>0.45), time in center (34.4±3.2 vs. 26.7±4.4, P>0.15); NO, entries in center (43.0±6.3 vs. 39.0±3.9, P>0.6), time in center (97.0±15.8 vs. 97.5±14.9, P>0.95).
(N) Model for LS Crfr2α+ neuronal valence based on optogenetic inhibition.
See also Figure S4.

