Figure 1.

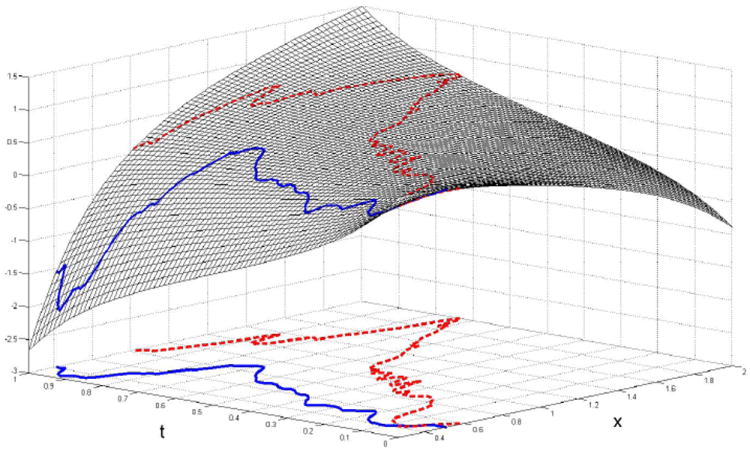
Estimated surface F̂(x, t) and two predictor curves for the DTI dataset. The solid curve belongs to a control and the dashed curve belongs to an MS patient.

Estimated surface F̂(x, t) and two predictor curves for the DTI dataset. The solid curve belongs to a control and the dashed curve belongs to an MS patient.