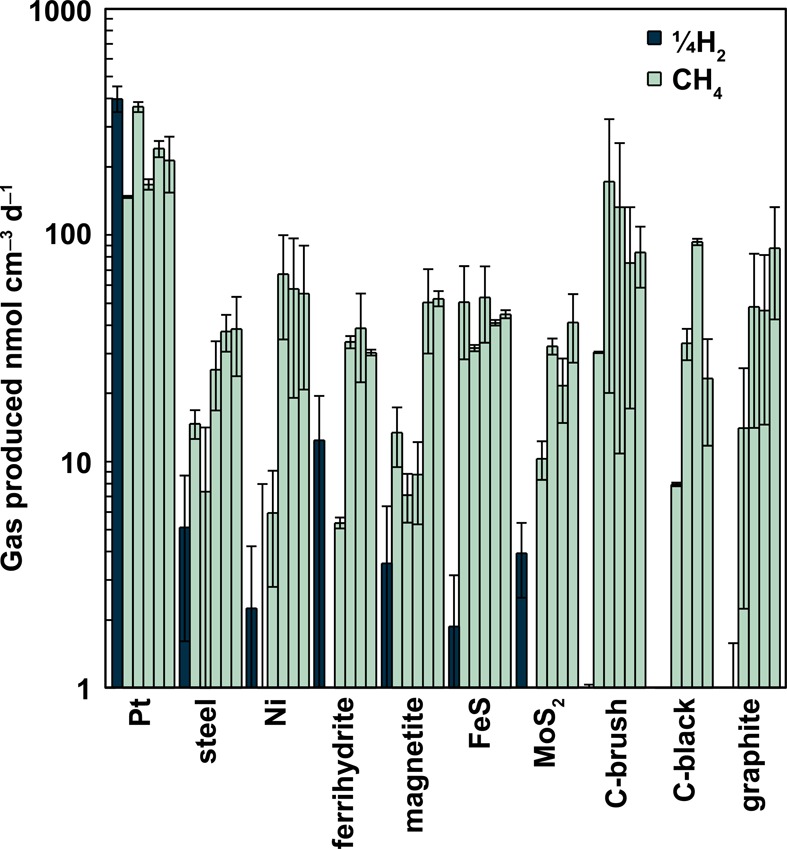
Figure 1.

Rates of abiotic hydrogen formation before inoculation (dark blue, batch cycle 0) and for methane production after inoculation (light green, batch cycles 1–5, listed in sequential order for each material). Hydrogen production rates are divided by 4 to normalize production for conversion to methane (assuming 4 mol hydrogen to produce 1 mol methane). Results are presented as averages after subtraction of rates of gas production in open circuit controls, with the error bars indicating the upper and lower range of the replicate reactors.
