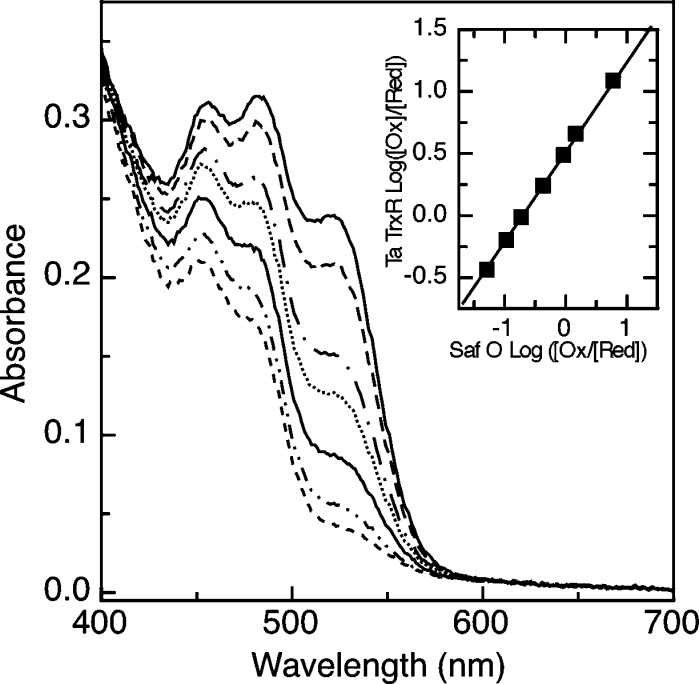
Figure 7.
Redox titration of the taTrxR flavin using the xanthine/xanthine oxidase reduction methodology of Massey (25), showing the decrease in the visible absorption spectrum, as collected every ∼5 min during the course of the reduction of the flavin cofactor. SafO was used as the reporter dye (maximum at 520 nm), as described in the Experimental Procedures. Inset: Plot of log [Ox]/[Red] for SafO vs log [Ox]/[Red] for TrxR, used to find the midpoint potential with respect to the reference value of SafO (−289 mV).

