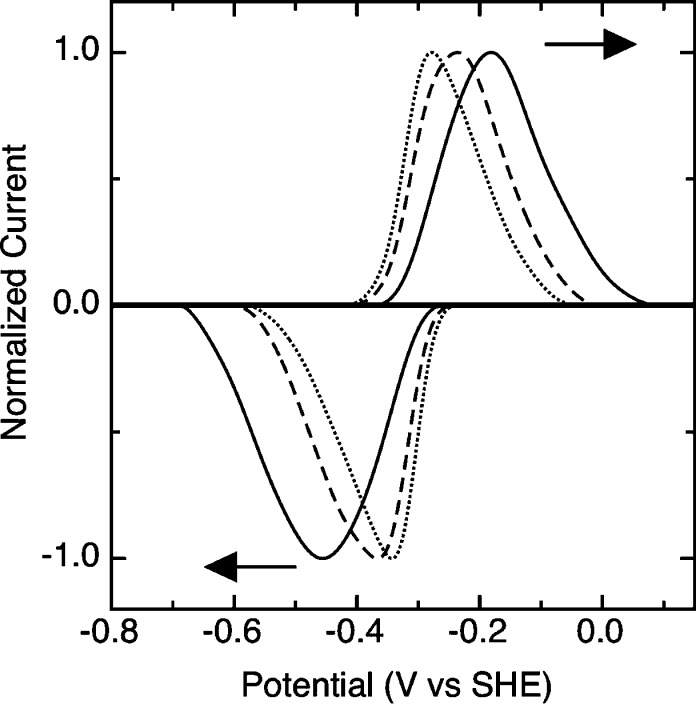
Figure 8.
Impact of increasing scan rate upon the taTrxR voltammetry at 308 K. Baseline-subtracted data are given to illustrate how, at elevated temperatures, the scan rate of the experiment can be raised from 200 mV/s (dotted line) to 2 V/s (dashed) to 20 V/s (solid), which results in broadening due to the observation of FO and FR states.

