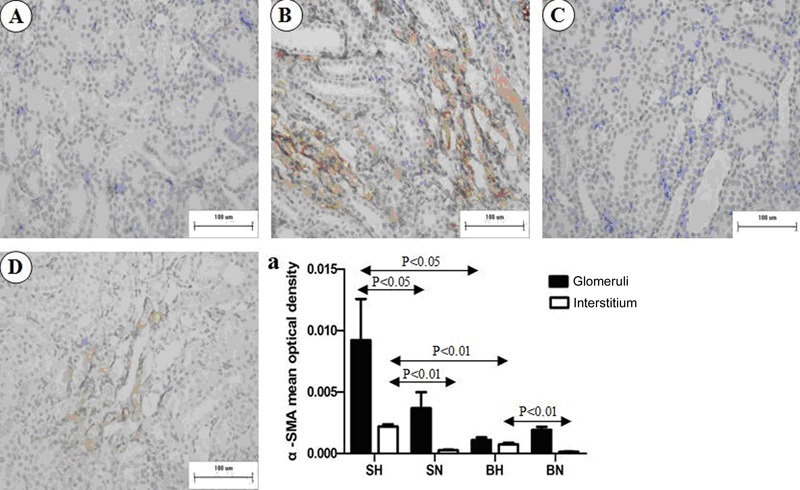
Figure 4. Representative images of immunostaining for α-SMA in renal medulla of all groups. A, SN group; B, SH group; C, BN group; D, BH group. a, Positive immunostaining of α-SMA was quantified in both glomeruli and interstitium. SN: Dahl salt-sensitive (SS) rats on a normal-salt diet (0.3% NaCl); SH: Dahl SS rats on a high-salt diet (8% NaCl); BN: SS-13BN rats on a normal-salt diet (0.3% NaCl); BH: SS-13BN rats on a high-salt diet (8% NaCl). One-way ANOVA was used for statistical analysis.

