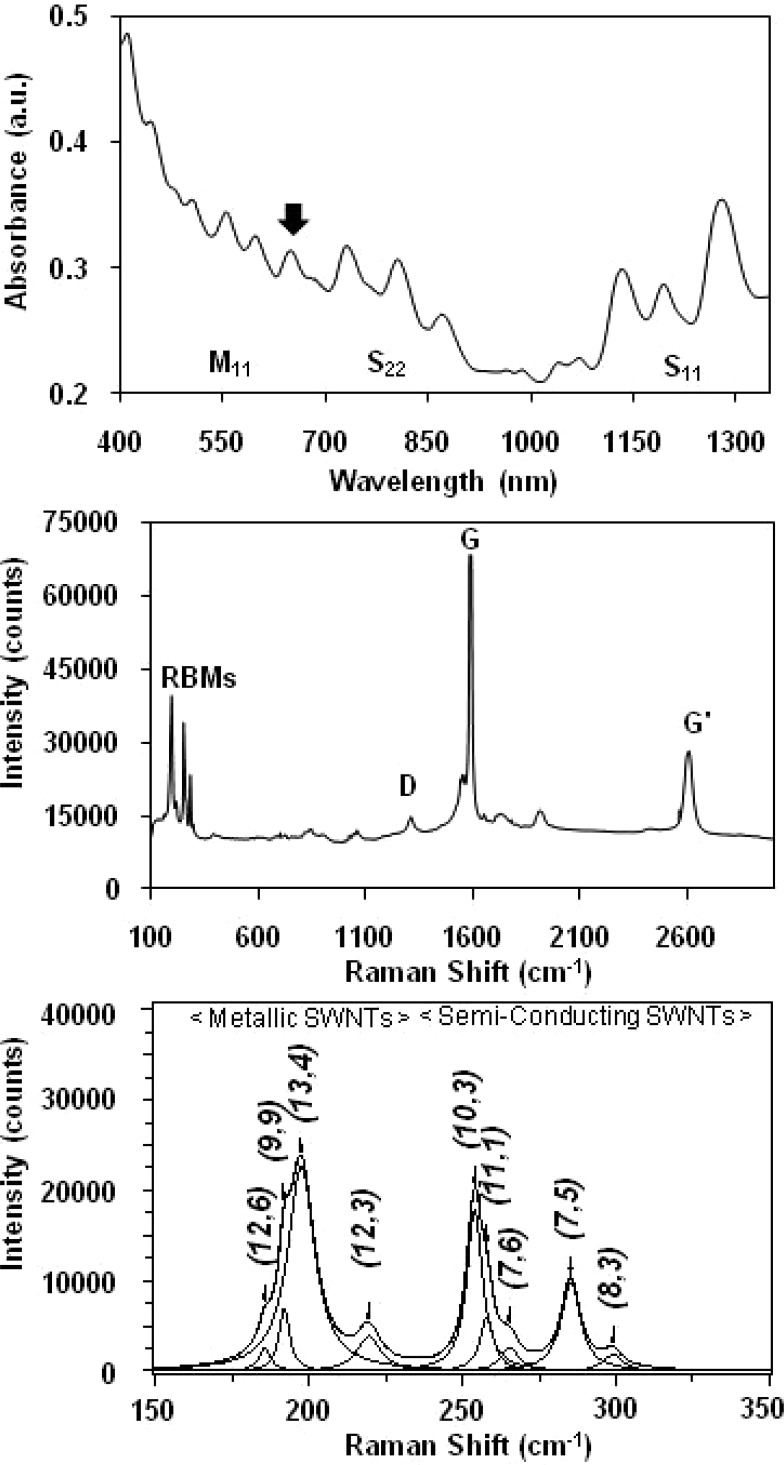
Figure 1.
(Top) Representative background-corrected UV–vis-NIR absorption spectrum of a HiPco BSA-SWNT dispersion; the arrow denotes ∼630 nm. (Middle) Representative Raman spectrum (632.8-nm laser excitation) of a HiPco BSA-SWNT dispersion showing the radial breathing modes (RBMs), the D-band, the G-band, and the G′-band. (Bottom) Representative baseline-corrected 632.8-nm Raman spectrum of a HiPco BSA-SWNT dispersion where the peak positions of the four metallic and five semiconducting SWNT structures (denoted by their (n,m) chiral indices) were obtained by curve fitting of the RBM region using a summation of Lorentzian line shapes.

