
Figure 3.
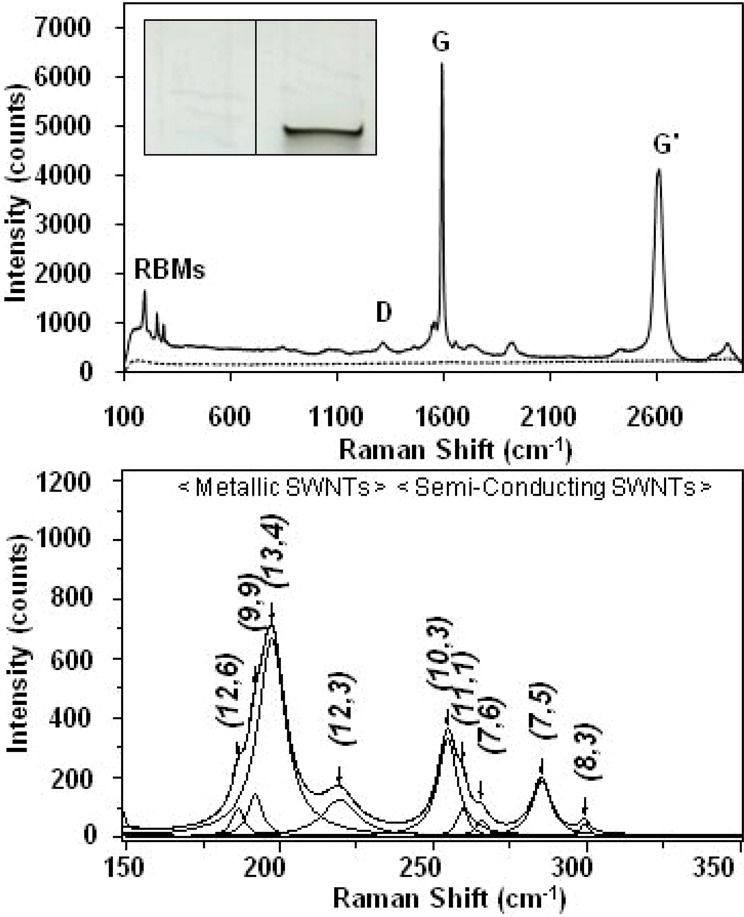
(Inset) Representative image of an 11 mm × 6 mm region of a SDS-PAGE gel showing the control (left) and sample (right) lanes. (Top) Representative Raman spectra (632.8-nm laser excitation) acquired from a SDS-PAGE gel lane loaded with lysate from cells incubated in medium containing ∼38 μg/mL HiPco BSA-SWNT material (solid line), and a control gel lane loaded with lysate from NRK cells incubated in medium without SWNTs (dashed line), following electrophoresis at 100 V for 2 h. (Bottom) Representative baseline-corrected 632.8-nm Raman spectrum of the RBM region acquired from the dark band in a SDS-PAGE gel lane loaded with lysate from cells incubated in medium containing ∼38 μg/mL HiPco BSA-SWNT material following electrophoresis at 100 V for 2 h. The peak positions of the four metallic and five semiconducting SWNT structures (denoted by their (n,m) chiral indices) were obtained by curve fitting of the RBM region using a summation of Lorentzian line shapes.