Figure 1.
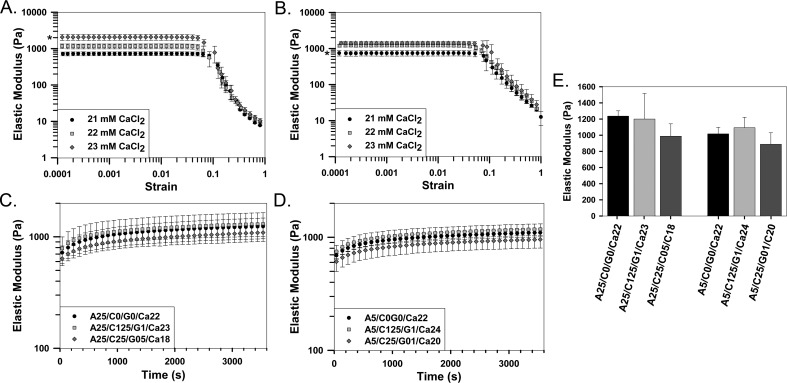
Sensitivity of hydrogel elastic modulus to changes in Ca2+ concentration and hydrogel composition. A-B) Strain sweeps demonstrating mM level sensitivity to changes in Ca2+ concentration for (A) 0.25% or (B) 0.5% alginate hydrogels. C-D) Gelation time tests demonstrating gelation kinetics for alginate or composite hydrogels with a base of (C) 0.25% or (D) 0.5% alginate. E) Comparison of elastic modulus of all hydrogels 30 minutes after beginning of the gelation time tests. n = 3, mean ± standard deviation. (* denotes statistically significance differences between all groups.)

