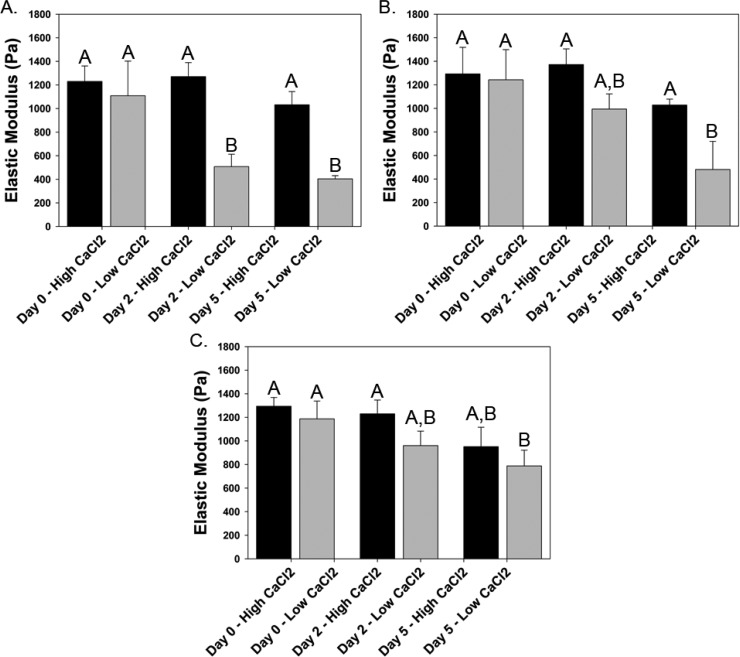
Figure 3.
Comparison of the change in ultimate elastic modulus following in situ gelation modeling for low and high calcium concentrations. Time tests demonstrating the effect of incubation in media containing low (normal) and high (elevated) Ca2+ concentrations for (A) A5/C0/G0/Ca22, (B) A5/C125/G1/Ca24, and (C) A5/C25/G01/Ca20 hydrogels. n = 3, mean ± standard deviation. (Bars with the same letters represent groups in which no statistical differences were observed, while bars with different letters are statistically different from one another.)

