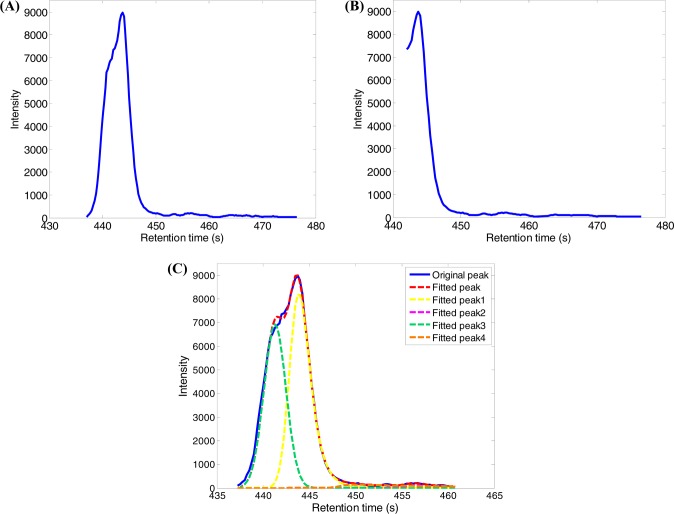
Figure 6.
Comparison of XIC construction using DBSCAN and m/z variation window approaches: (A) XIC of a peak with m/z value of 812.6157 constructed from sample S403 by DBSCAN; (B) XIC of the same peak constructed using a m/z variation window of 7 ppm; (C) four fitted peaks by EMGM model using the XIC data presented in part A.

