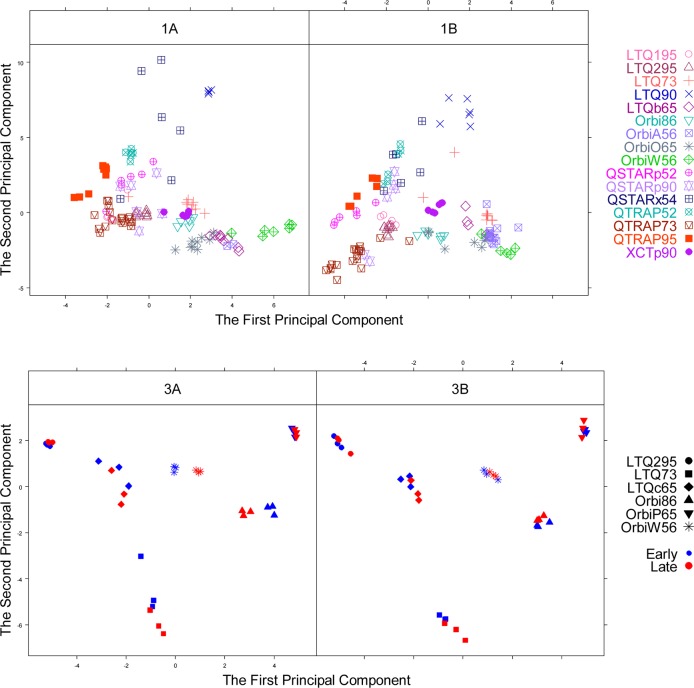
Figure 1.
The plot of the first two principal components. The upper two panels are for the 16 electrospray mass spectrometers from CPTAC Study 1. The left panel is for Sample 1A (digested on-site) and the right panel is for Sample 1B (centrally digested at NIST). The lower two panels are for the six mass spectrometers from CPTAC Study 5. The left panel is for Sample 3A (the yeast reference material) and the right panel is for Sample 3B (yeast reference material spiked with bovine serum albumin). The first three experiments are labeled as blue (“early”), and the last three experiments are labeled as red (“late”).

