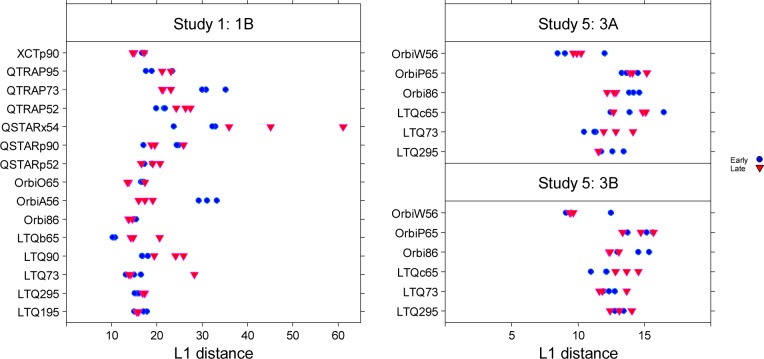
Figure 4.
The L1-distance. Left panel: the L1 distance for 90 experiments within 70 days used in ANOVA model for the mass spectrometer and batch effect study for Study 1. Right panel (upper): L1 distance for Sample 3A in Study 5. Right panel (lower): L1 distance for Sample 3B in Study 5. Distances observed for Study 1 ranged much higher than for Study 5.

