
Figure 5.
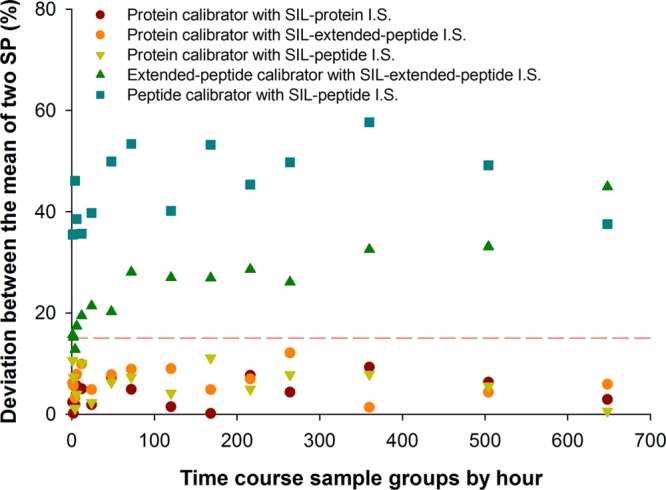
The extent of inconsistency between the two SP in the time course samples. The deviation between quantitative results obtained by the two signature peptides was used as a gauge for the reliability of the quantification method. For each of the calibration approaches, the average deviation of samples within the same time point group was calculated (N = 4 per time point). The threshold of acceptance was deviation < 15% (red line) between the two SP.