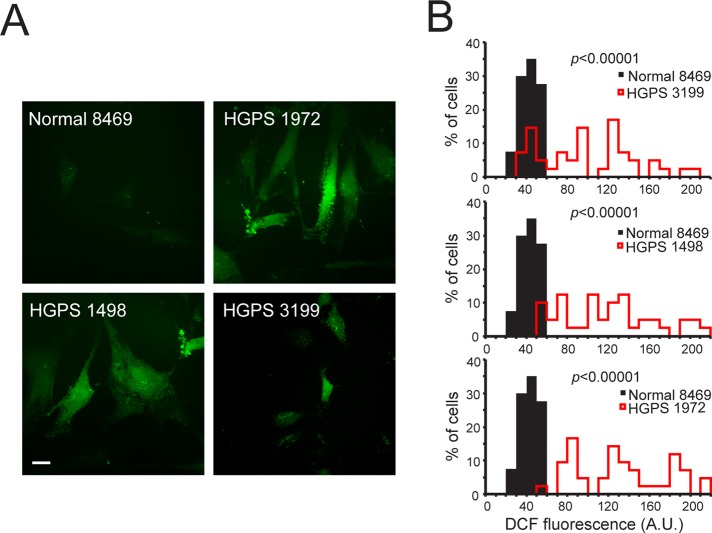
FIGURE 3:
Fibroblasts from HGPS patients have elevated ROS. (A) ROS detected in primary fibroblasts from control (8469) and progeria patients (1972, 1498, and 3199) using DCF. (B) Histograms comparing total ROS levels in control (black bars) and progeria patient fibroblasts (red lines). Bin size, 10. Scale bars, 20 μm.

