FIGURE 8:
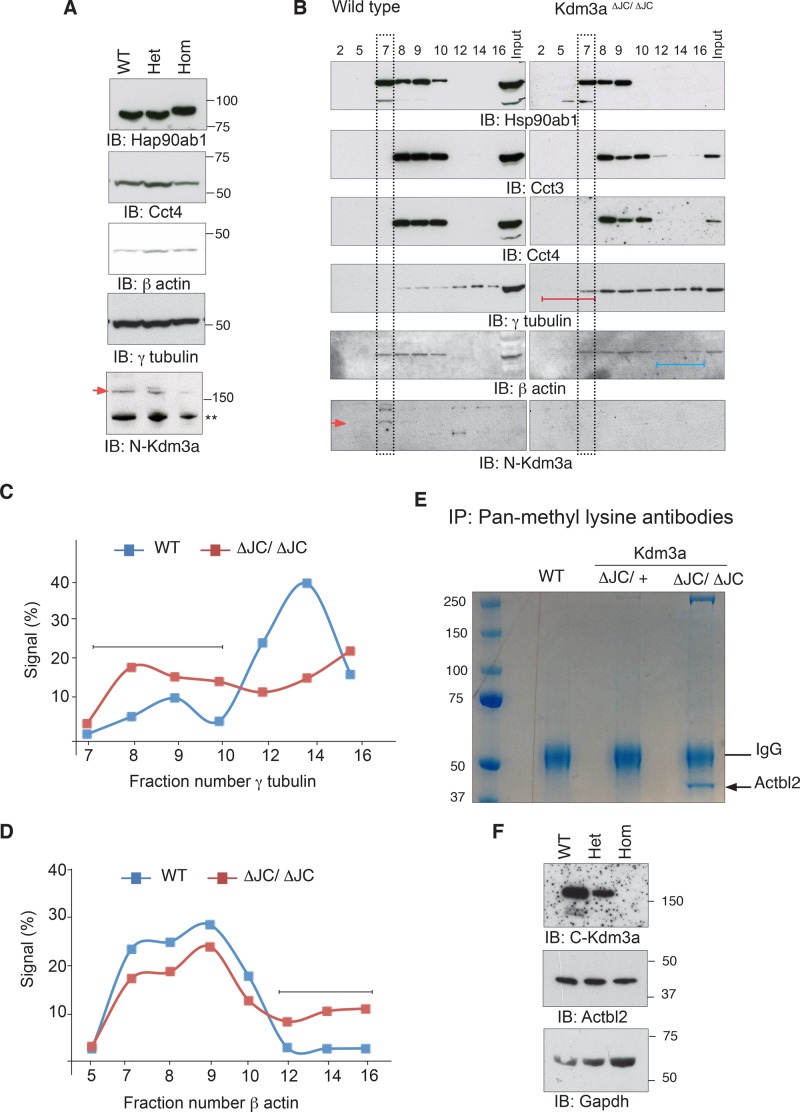
Altered state of cytoskeletal components in the cytoplasm of Kdm3aΔJC/ΔJC mice. (A) Total extracts from testis immunoblotted with the indicated antibodies show comparable levels between Kdm3a genotypes. (B) Cytoplasmic extracts from testis fractionated in discontinuous sucrose gradients (40–70%). The migration of each protein along the gradient was determined with the relevant antibodies. Lines represent the early soluble components (red) and late larger complexes (blue). Sedimentation of the bulk of cytoplasmic proteins is indicated (black rectangles). Red arrowhead indicates FL-Kdm3a, see also Figure S3A. (C) Percentage of signal intensity of each fraction relative to the sum of intensities along the fractions plotted in this graph illustrates the distribution profiles of γ-tubulin in wild-type (WT) and Kdm3aΔJC/ΔJC sucrose gradients. See Figure S2C for measurements. (D) Percentage intensity of each fraction relative to the sum of intensities along the fractions plotted in this graph illustrates the distribution profiles of β actin in wild-type (WT) and Kdm3aΔJC/ΔJC sucrose gradients. Black lines point to the most differing aspect of gradients between genotypes. (E) Total testis extracts were immunopurified with a pool of antibodies to mono-, di-, and trimethylated lysines. A single band is observed in Kdm3aΔJC/ΔJC pull downs only, subsequently identified by MS as Actbl2. (F) Total extracts from testis immunoblotted with the indicated antibodies show comparable levels of Actbl2 between Kdm3a genotypes.

