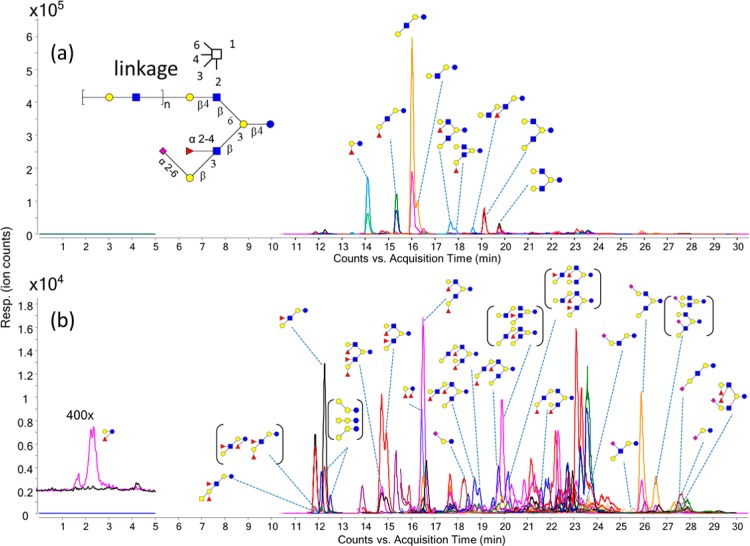
Figure 3.
Extracted MRM chromatogram. The MRM transitions monitored are provided in Supporting Information Table S-1. Peaks are labeled with corresponding structures. Structures in parentheses mean they could not be specifically resolved or identified. (a) The total dynamic MRM chromatogram monitored for a pooled human milk oligosaccharide sample. Nine abundant HMO compounds can be readily identified and annotated. (b) Lower abundant HMOs are identified and annotated: blue circles, Glc (glucose); yellow circles, Gal (galactose); blue squares, GlcNAc (N-acetylglucosamine); yellow squares, GalNAc (N-acetylgalactosamine); red triangles, Fuc (fucose); purple diamonds, Neu5Ac (N-acetylneuraminic acid).

