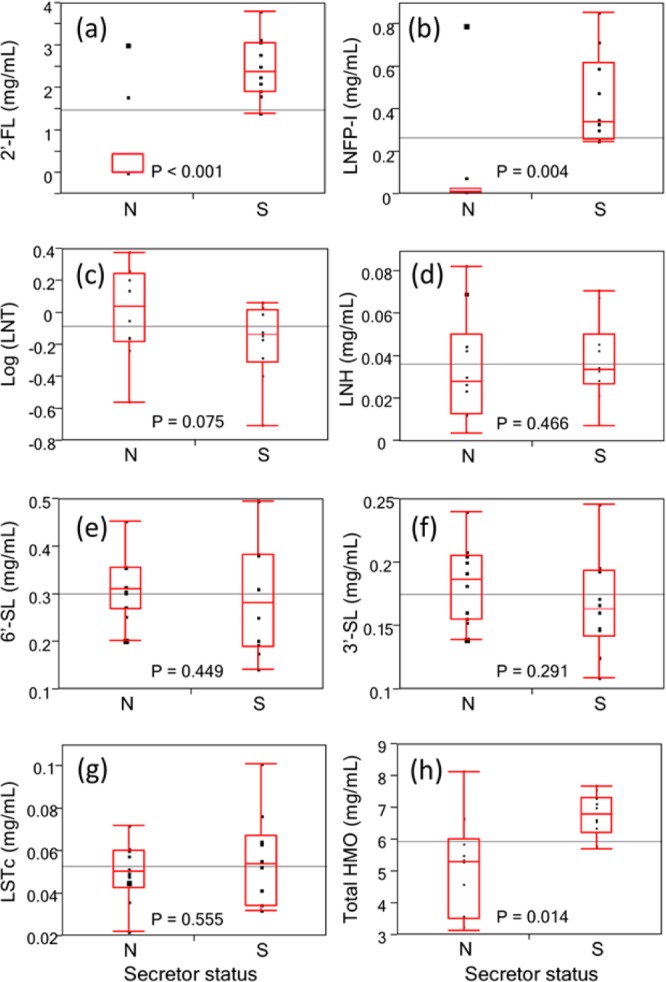
Figure 4.

Box-and-whisker diagrams for secretor mothers (S) and nonsecretor mothers (N) reveal that nonsecretor mothers produce lower amounts of 2′-FL (P < 0.001) and LNFP-I (P = 0.004) than secretor mothers. However, there are some outliers who still produce similar amounts of 2′-FL or/and LNFP-I with secretor mothers, while their total α(1–2) fucosylation is still at relatively low level. The total HMO content produced by nonsecretor mothers is also lower (P = 0.014, Mann–Whitney–Wilcoxon test) than that of secretor mothers using the nonparametric test. (a) 2′-FL. (b) LNFP-I. (c) LNT. (d) LNH. (e) 6′-SL. (f) 3′-SL. (g) LSTc. (h) Total HMO content. Reported P-values are from one-tail Student t test unless specified.
