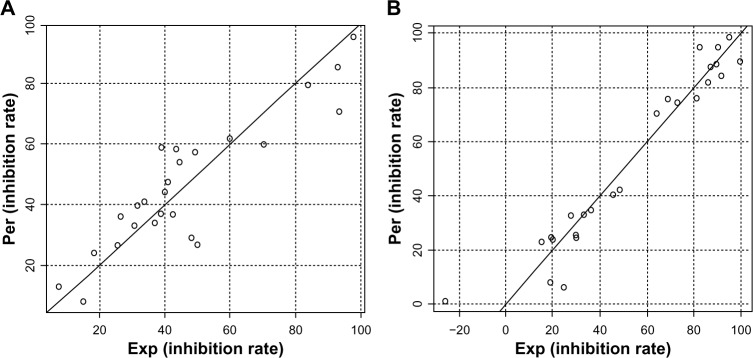
Figure 3.

Plots of predicted activity against the corresponding experimental activity on TNF-α and IL-6 inhibition.
Notes: (A) TNF-α and (B) IL-6. The numbers in parentheses indicate the standard deviation of the coefficients. (AEq1: IRTNF-α=1229.07 [±132.09] + 119.51 [±26.68] Moran −1255.87 [±140.60] WHIM −2230.10 [±322.05] EEVA, N=26, R2=0.80, Radj2=0.78, s=11.32, F3,22=29.75, P=6.33e-08; BEq2: IRIL-6=76.15 [±17.83] + 62.36 [±11.26] H-GETAWAY + 1506.83 [±170.77] R-GETAWAY −8.02 [±1.58] EEVA, N=26, R2=0.93, Radj2=0.92, s=9.35, F3,22=98.79, P=6.42e-13). The F-value is related to the F-statistic analysis (Fisher’s test).
Abbreviations: Per, predicted activity; Exp, experimental activity; TNF-α, tumor necrosis factor-α; IL-6, interleukin-6; Eq, equation; IR, inhibition rate; Moran, Moran topological autocorrelation descriptors; WHIM, Weighted Holistic Invariant Molecular descriptors; EEVA, electronic Eigenvalue descriptors; N, the number of compounds taken into account in the regression; R2, the multiple correlation coefficient; Radj2, adjusted multiple correlation coefficient; s, residual standard error; GETAWAY, GEometry, Topology and Atom-Weights AssemblY descriptors.
