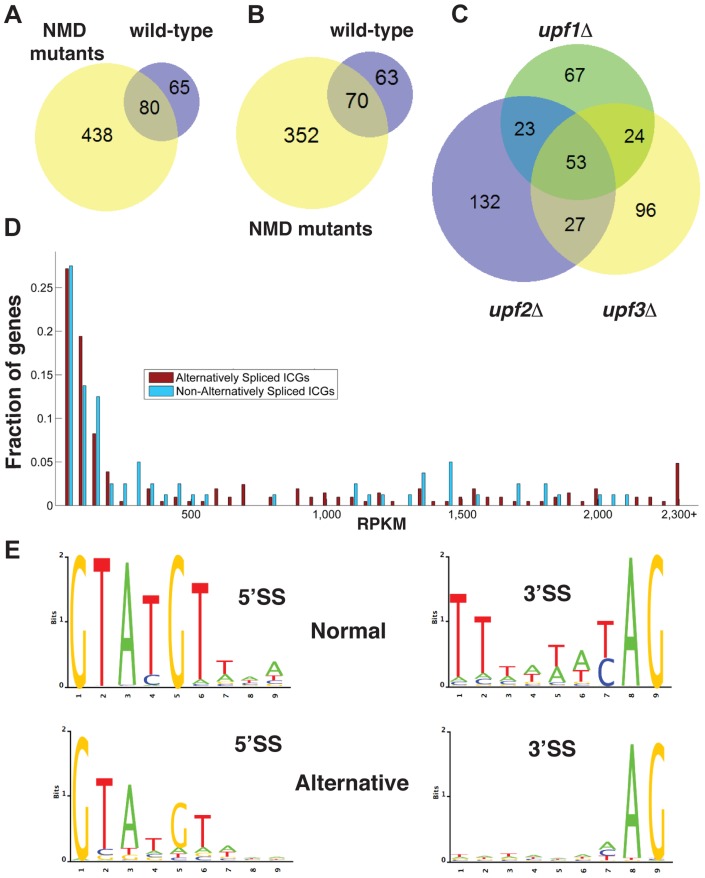
Figure 1. Bioinformatics analysis of alternative splice site usage in wild-type and NMD mutants.
A. Venn diagram showing the overlap of alternative splice site usage between the wild-type and three NMD mutants pooled for all unique non-canonical splicing events (both PTC-generating and non-PTC-generating). B. Venn diagram showing the overlap of alternative splicing events between the wild-type and three NMD mutants pooled for all unique non-canonical splicing events resulting in a potential PTC. C. Venn diagram showing the overlap of alternative splicing events between the upf1Δ, upf2Δ, and upf3Δ strains for PTC-generating splicing events. D. Distributions of intron-containing gene transcripts showing alternative splicing events (red) or no alternative splicing events (blue) according to their overall abundance in RPKM. Transcripts for which the abundance was higher than 2,300 RPKM were grouped in the final bin. E. Sequence logo analysis of 5′- and 3′- splice sites for all normal and alternative splicing events detected by RNA-Seq in wild-type and NMD mutant strains.

