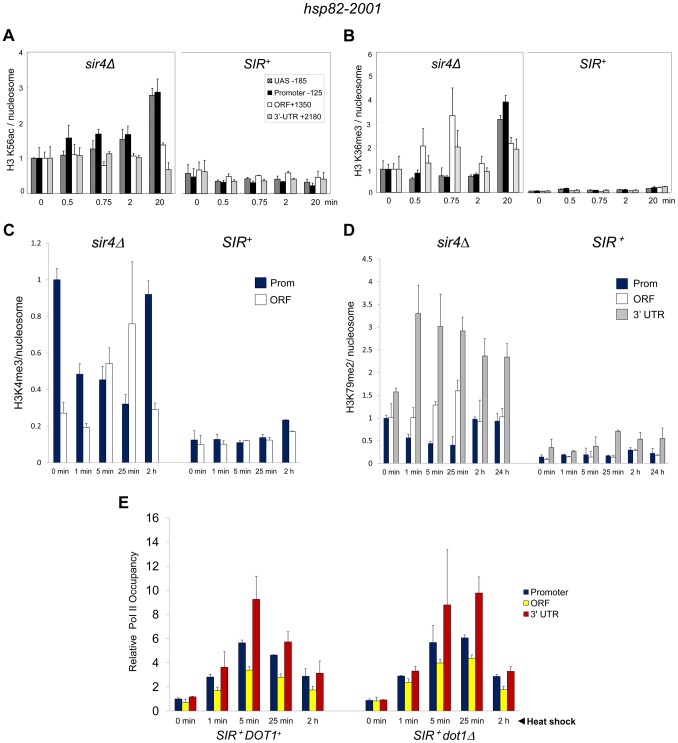
Figure 6. Heterochromatic gene activation occurs in the context of minimal transcription-linked H3 methylation and is unimpaired by ablation of Dot1.
(a) H3K56ac ChIP analysis of hsp82-2001 in sir4Δ or SIR+ cells subjected to an instantaneous 30° to 39°C thermal upshift for the times indicated. Quantification was done using Real Time qPCR. The acetylated H3K56/Myc-H4 quotient of the non-induced sir4Δ sample was set to 1.0 for each amplicon. PTM-specific and Myc-H4 signals at the heat shock transgene were normalized to those measured at PMA1 and ARS504, respectively. Shown are means ± S.D. (N = 2; qPCR = 4). (b) H3K36me3 ChIP analysis of hsp82-2001 conducted as in A. (c) H3K4me3 ChIP analysis of hsp82-2001 in sir4Δ or SIR+ cells subjected to an instantaneous 30° to 39°C thermal upshift for the times indicated. Quantification and scaling were done as in A, except H3K4me3/H3 quotients are depicted, and both PTM-specific and H3 signals were normalized to those measured at ARS504. Shown are means ± S.D. (N = 2; qPCR = 4). (d) H3K79me2 ChIP analysis of hsp82-2001 in sir4Δ or SIR+ cells as in C. (e) Pol II ChIP analysis of heterochromatic hsp82-2001 in DOT1+ and dot1Δ strains subjected to heat shock as above. Pol II occupancy was determined using ChIP-qPCR as in Figure 3A. Shown are means ± S.D. (N = 2; qPCR = 4).

