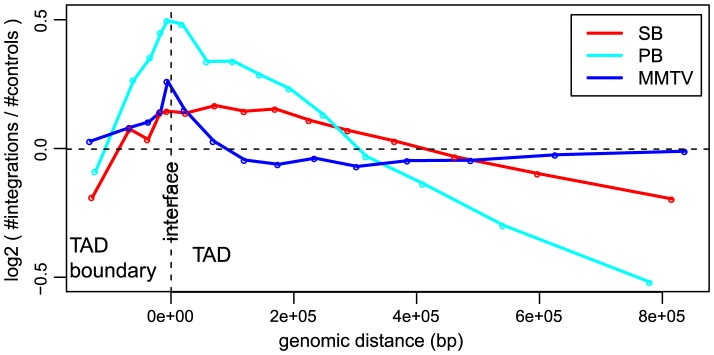
Figure 3. Unselected integration profiles with respect to TAD - TAD boundary interface.

The  -axis represents genomic distance from the interface. The
  -axis represents the log2 ratio of observed number of integrations versus the expected number of integrations.
