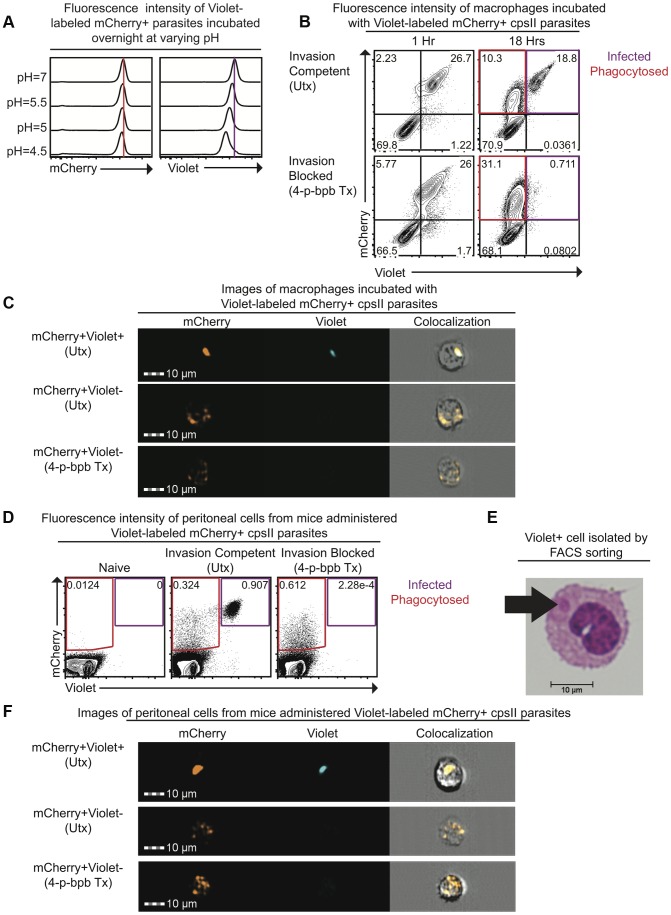
Figure 1. Differences in pH sensitivity of two fluorescent markers can be used to distinguish parasites that have been phagocytosed from those that actively invade host cells.
Fluorescence intensity of mCherry-expressing cpsII parasites labeled with CellTrace Violet and incubated overnight at varying pH in buffer solutions consisting of citric acid and disodium phosphate [93] was measured by flow cytometry (a). Violet and mCherry fluorescence of immortalized murine bone marrow-derived macrophages exposed to Violet-labeled, mCherry-expressing cpsII parasites pre-treated with DMSO (top) or the irreversible inhibitor of invasion 4-p-bpb (bottom) 1 hour and 18 hours following exposure to parasites, measured by flow cytometry (b). Images of mCherry+veViolet+ve and mCherry+veViolet−ve bone marrow-derived macrophages 18 hours following exposure to Violet-labeled, mCherry-expressing cpsII parasites pre-treated with 4-p-bpb or DMSO (c). Violet and mCherry fluorescence of cells isolated from the PECS of mice 18 hours post-administration of 106 DMSO-treated or 4-p-bpb-treated parasites (d). Cytospin analysis was performed on Violet+ve cells isolated by FACS sorting, obtained from the PECS of a mouse 18 hours after vaccination with Violet-labeled cpsII parasites (e). Images of mCherry+veViolet+ve and mCherry+veViolet−ve cells isolated from the PECS of mice 18 hours post-administration of 106 DMSO-treated or 4-p-bpb-treated Violet-labeled, mCherry-expressing cpsII parasites (f).

