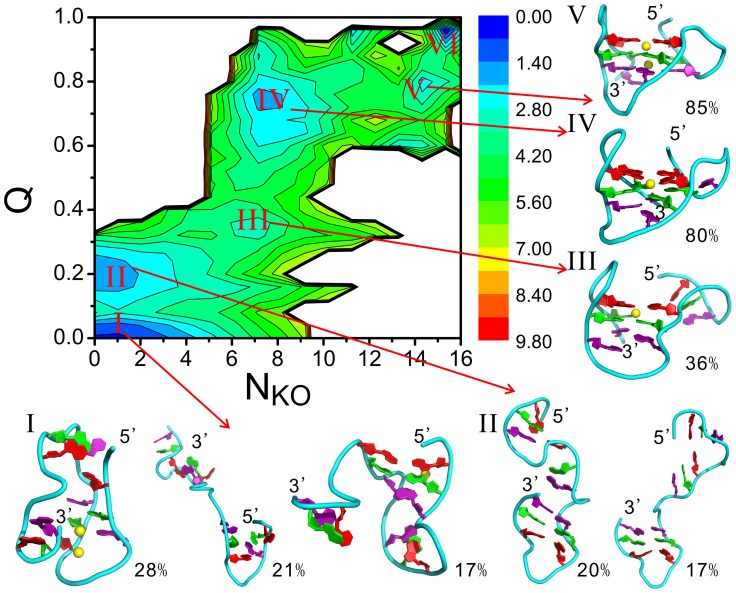
Figure 1. The free energy landscape and the representative structures of the basins of attraction.
The unit of the free energy is kcal/mol. Multiple representative structures are given for the first two basins, due to the their heterogeneous nature. The populations of the representative structures within their respectively basins are roughly estimated and indicated by the numbers beside them. The three G-tetrads in the structures are colored red, green, and purple, respectively. This color code will be used throughout the whole text unless otherwise indicated. The  ions bound to DNA are shown as yellow spheres.

