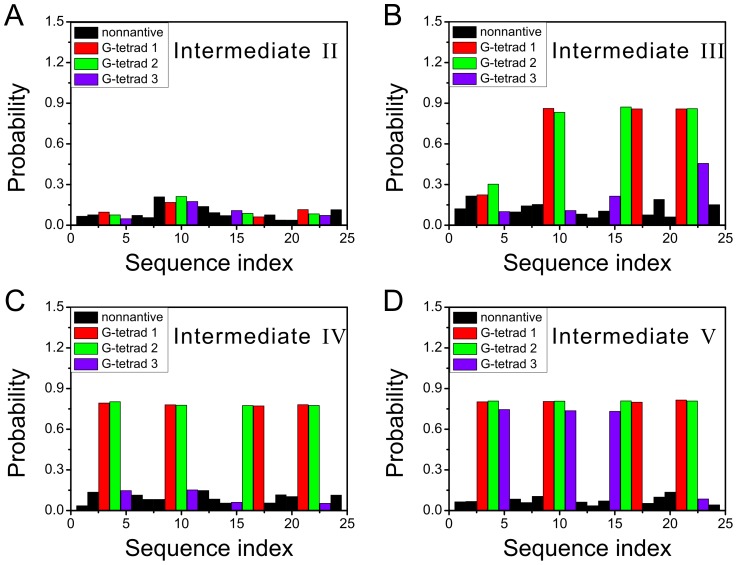
Figure 4. The  ion binding probabilities for the four intermediates.
(A)–(D) are for the intermediate-II, III, IV, and V, respectively. The color code is the same as in Figure 1, i.e., the red, green, and purple histograms correspond to the three G-tetrads, respectively. The black histograms indicate the binding probabilities on the non-native sites.

