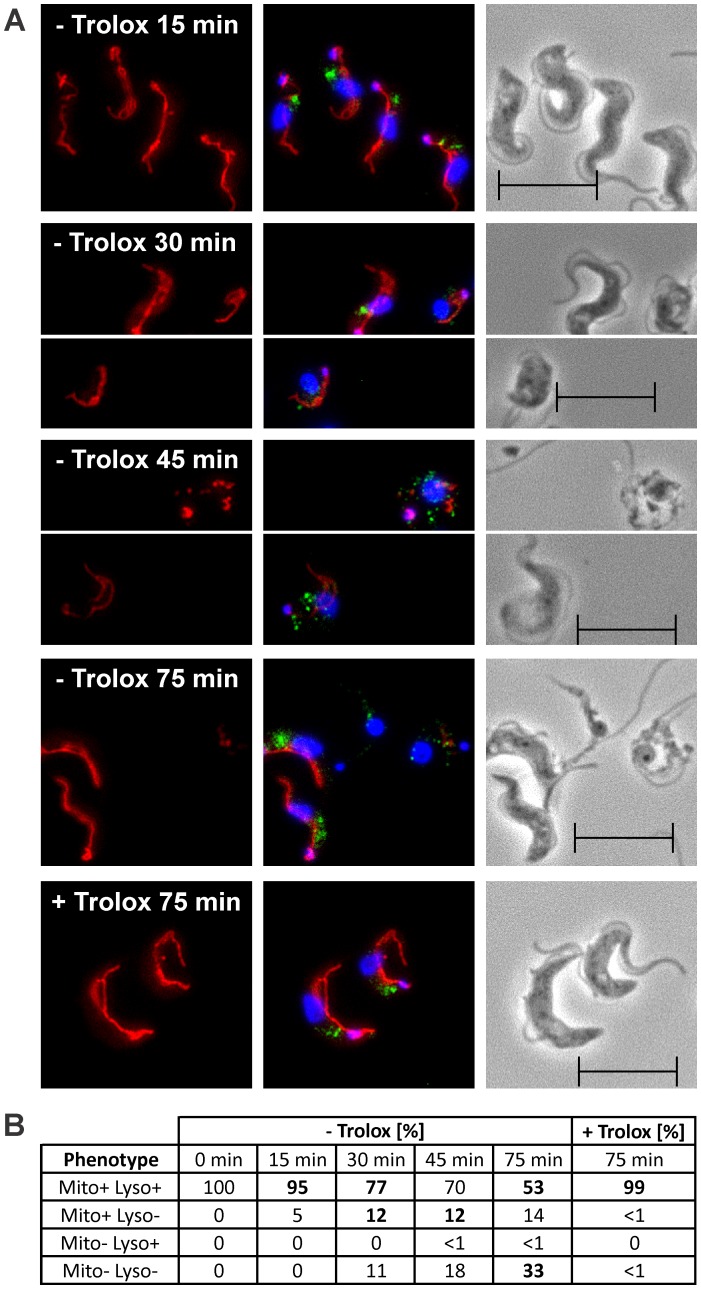
Figure 5. Lysosomal disintegration precedes damage of the mitochondrion.
The px I–II −/− BS cells were kept for the indicated times at 37°C in medium ± Trolox and then subjected to immunofluorescence analysis. A. MitoTracker staining (left), overlay of the signals for MitoTracker (red), p67 (green), and DAPI (blue) (middle), and phase contrast images (right). B. Quantitative analysis of the staining pattern of the cells (for details, see text). The phenotypes visible in the respective pictures in (A) are highlighted by bold numbers. For each time point, at least 194 cells were inspected. The data are representative of two independent sets of experiments giving very similar results. (Scale bar: 10 µm).

