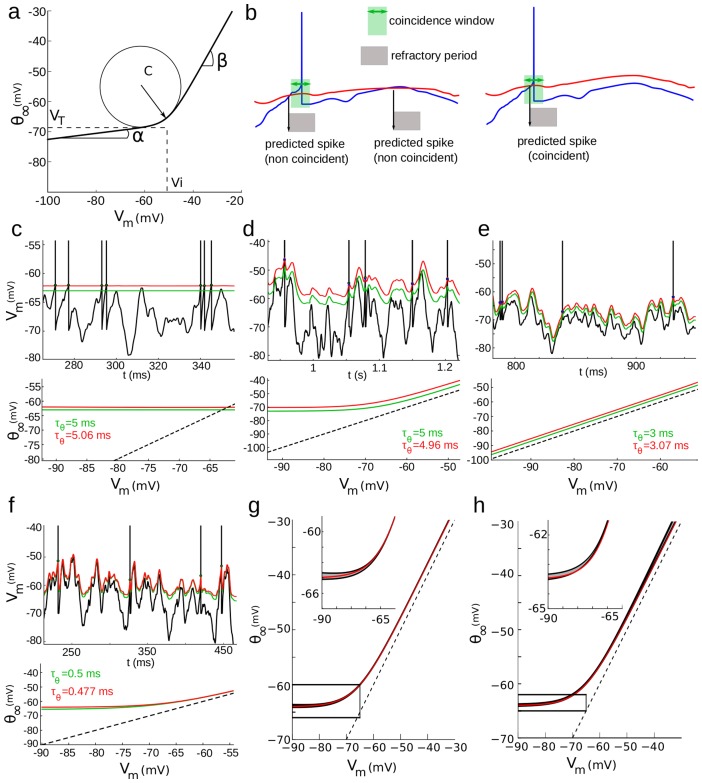
Figure 2. Model fitting approach.
a, Steady-state threshold function, defined by 5 parameters. b, Illustration of the model fitness computation, Voltage trace (blue) and the corresponding dynamic threshold in the model (red). A spike is predicted when the curves cross, and a refractory period follows (grey). Prediction is considered correct when the actual and predicted spikes are within a fixed coincidence window (green). Left: incorrect predictions, right: correct prediction. Note that for the sake of illustration the coincidence window is drawn larger than what it is in reality. c–f, Top: output of the fitting procedure on neuron models with explicit dynamic threshold (green: actual dynamic threshold, red: model prediction), with four different steady-state threshold functions and threshold time constants (bottom). g, The fitting procedure was run for the same model shown in f, but with input currents varying in mean (20–200 pA) and standard deviation (50–400 pA). The shaded area shows the mean and standard deviation of the fitted steady-state threshold function: optimization results were not strongly dependent on the input current used for training. h, Same as g, but with  ms and input current with short autocorrelation time constant (0.5 ms).

