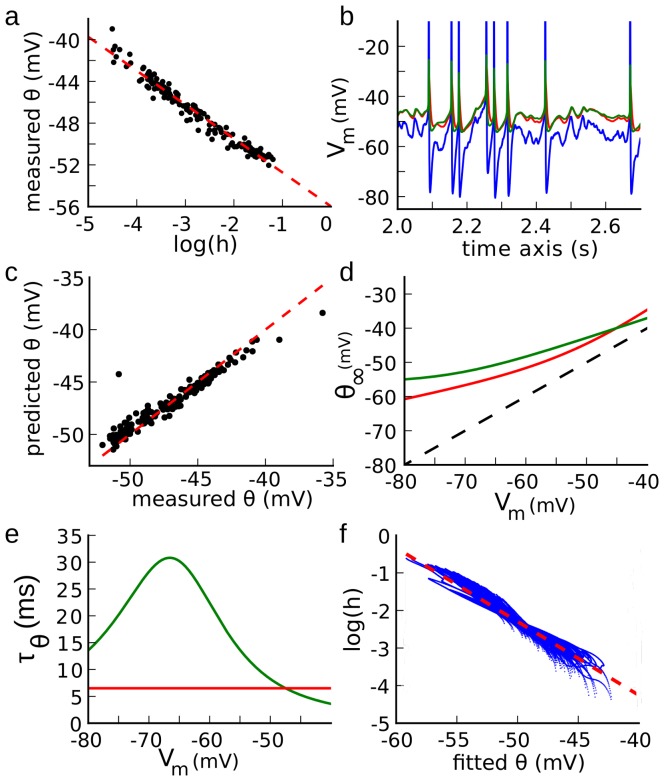
Figure 3. Fitting procedure applied on a multicompartmental model of a cortical neuron.
[7] . a, Spike threshold measured at the soma vs. logarithm of the sodium inactivation variable h at the axonal initiation site. The dashed line shows the linear regression (slope 3.2 mV). b, The fitting procedure is run on the somatic voltage trace (blue), and the predicted threshold (red) is compared to the threshold calculated from the value of ionic channel variables (green; as in [26]). c, Predicted threshold resulting from the fitting procedure vs. measured threshold for all spikes. The dashed line is the identity. d, Steady-state threshold function of the optimized model (red) compared to the corresponding function calculated from the properties of sodium channel inactivation. e, Estimated time constant of threshold adaptation (red) vs. time constant of sodium inactivation. The estimation is correct in the spike initiation zone (−50 to −40 mV). f, Logarithm of the sodium inactivation variable h at the axonal initiation site plotted against predicted threshold for the entire simulation, excluding spikes.

