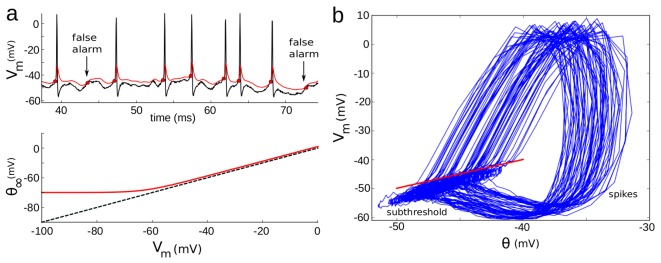
Figure 4. Fitting procedure applied on an intracellular voltage trace.

a, Top: voltage trace (top, black) and predicted threshold (red). Bottom: steady-state threshold in the fitted model. b,  vs. predicted threshold for the trace in (a). The identity line (red) sharply separates subthreshold fluctuations from spikes.
