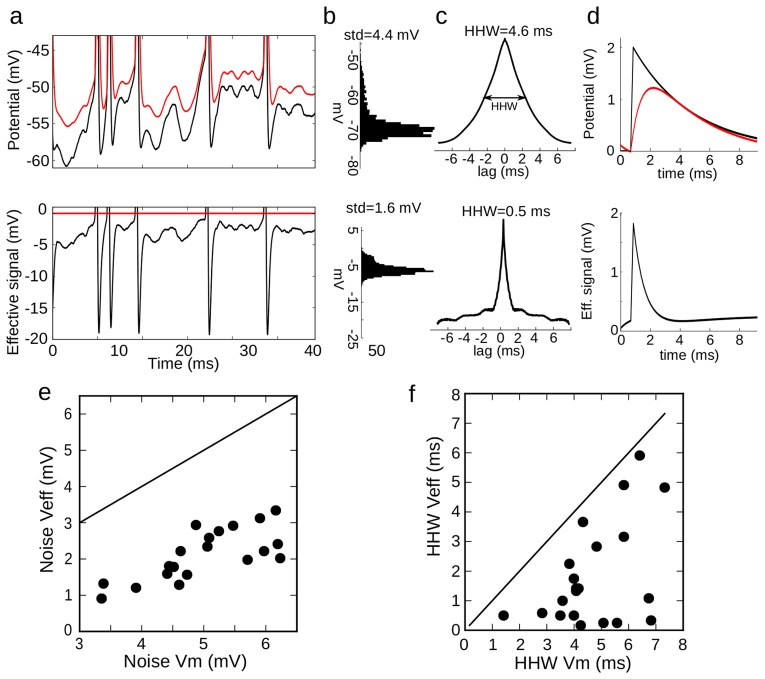
Figure 8. Effective signal.
a, Top: voltage trace  (black) and the corresponding fitted threshold (red). Bottom: the effective signal (black) is the difference. A spike occurs when it crosses 0 mV (red). b, Distribution of
  (top) and of the effective signal (bottom). c, Autocorrelogram of
  (top) and of the effective signal (bottom), showing the half-height width (HHW). d, Top: postsynaptic potential (PSP, black) and its effect on the threshold (red). Bottom: effective PSP. e, Standard deviation of the effective signal vs. standard deviation of
  (line: identity). f, HHW of the effective signal's autocorrelogram vs. HHW of
  's autocorrelogram.

