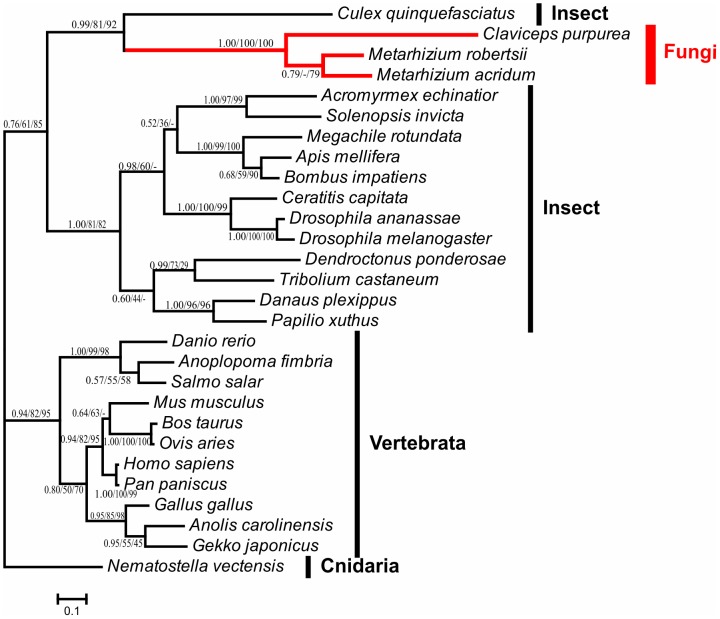
Figure 2. Phylogenetic analysis of fungal NPC2a proteins and their homologs.
The Bayesian inference tree is shown unrooted. Numbers at nodes represent bayesian posterior probabilities (left) and bootstrap values of maximum likelihood (middle) and neighbor-joining (right) respectively. Hyphen (-) indicates no support value in corresponding method. The scale bar corresponds to the estimated number of amino acid substitutions per site. Branches of Clavicipitaceae (fungi) are indicated in red. The information about the sequences used in this analysis is presented in Table S2.

