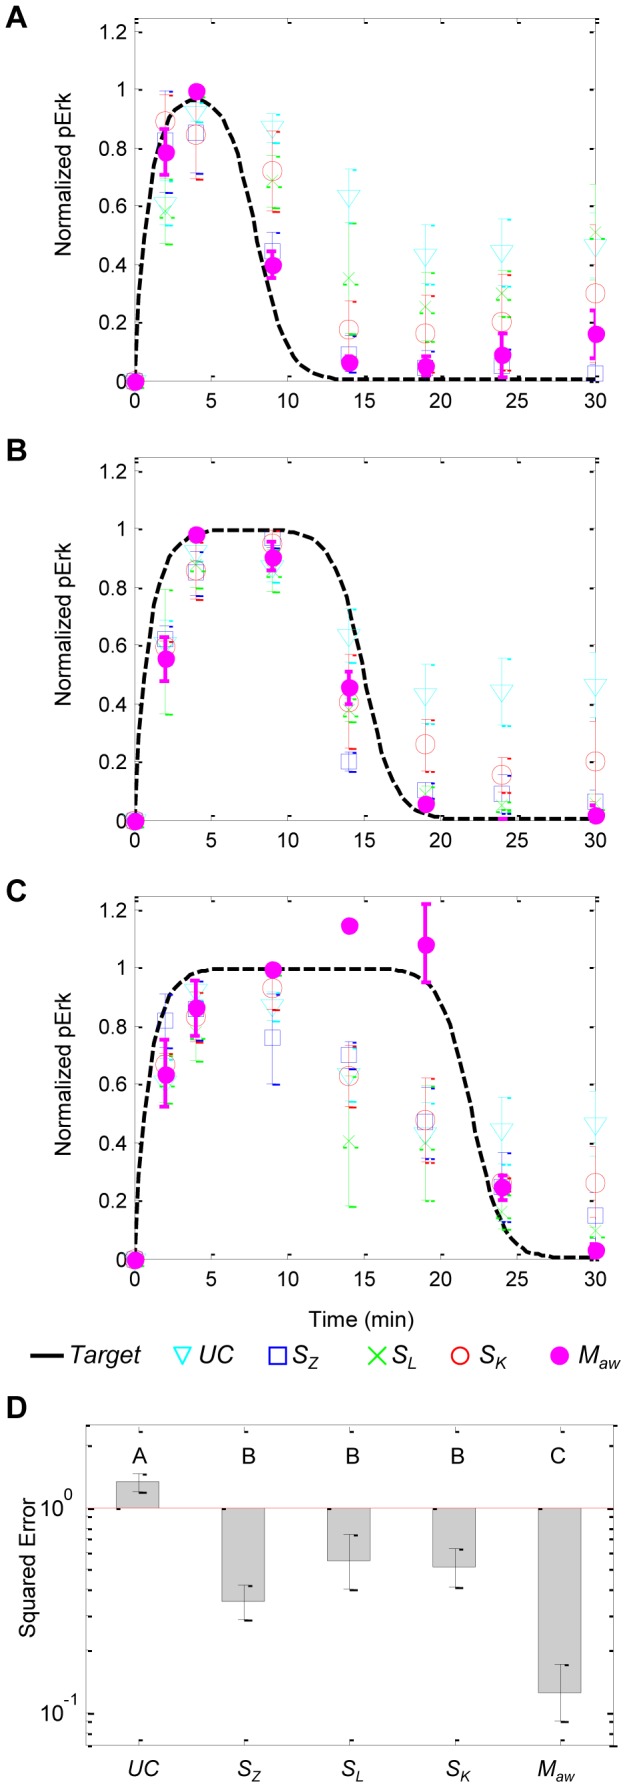
Figure 6. Overall in vitro target tracking performances between target profiles and measured Erk phosphorylation.

Experiments with target trajectories (solid black) defined by the (toff, pss) pairs of (A) (8,0), (B) (15,0) and (C) (22,0). Data are measurements of plant dynamics that were uncontrolled (UC, cyan triangle, n = 12) and controlled by SZ (blue square, n = 9), SL (green x, n = 9), SK (red circle, n = 9) and Maw (magenta dot, n = 9). Data shown are mean ± standard error. (D) Controller performances as measured by squared error between target trajectories and controlled plant dynamics. Group letters denote statistically significant differences between groups (p<0.05) as calculated by one-way ANOVA with Tukey multiple comparisons test (SigmaStat v3.5, Systat Software, Inc).
