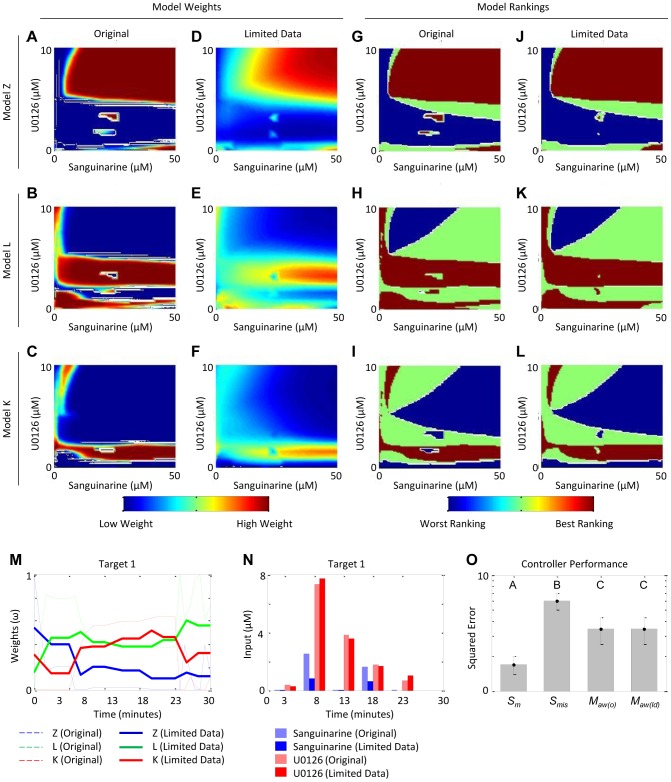
Figure 7. Analysis of uncertainty in the model weight maps and resulting predicted control strategies and performance.
Model weights over the input space for (A–C) the original case study (full dataset) and (D–F) the case study with the limited dataset. Model rankings over the input space for (G–I) the original case study (full dataset) and (J–L) the case study with the limited dataset. (M) Adaptive weights and (N) corresponding control input regimen for the exemplar experiment characterized by the target trajectory defined by the pair (toff = 8, pss = 0). (O) Controller performances as measured by squared error between target trajectories and plant dynamics controlled by single-model controllers that are matched (Sm, n = 30) and mismatched (Smis, n = 60), and adaptively-weighted multiple-model controllers with the original “digital” weight maps (Maw(o), n = 30) and smoother weight maps from the limited dataset (Maw(ld), n = 30). Data shown are mean ± standard error. Group letters denote statistically significant differences between groups (p<0.05) as calculated by one-way ANOVA with Tukey multiple comparisons test (SigmaStat v3.5, Systat Software, Inc).

