
Figure 8. Training data used to generate the model weight maps.
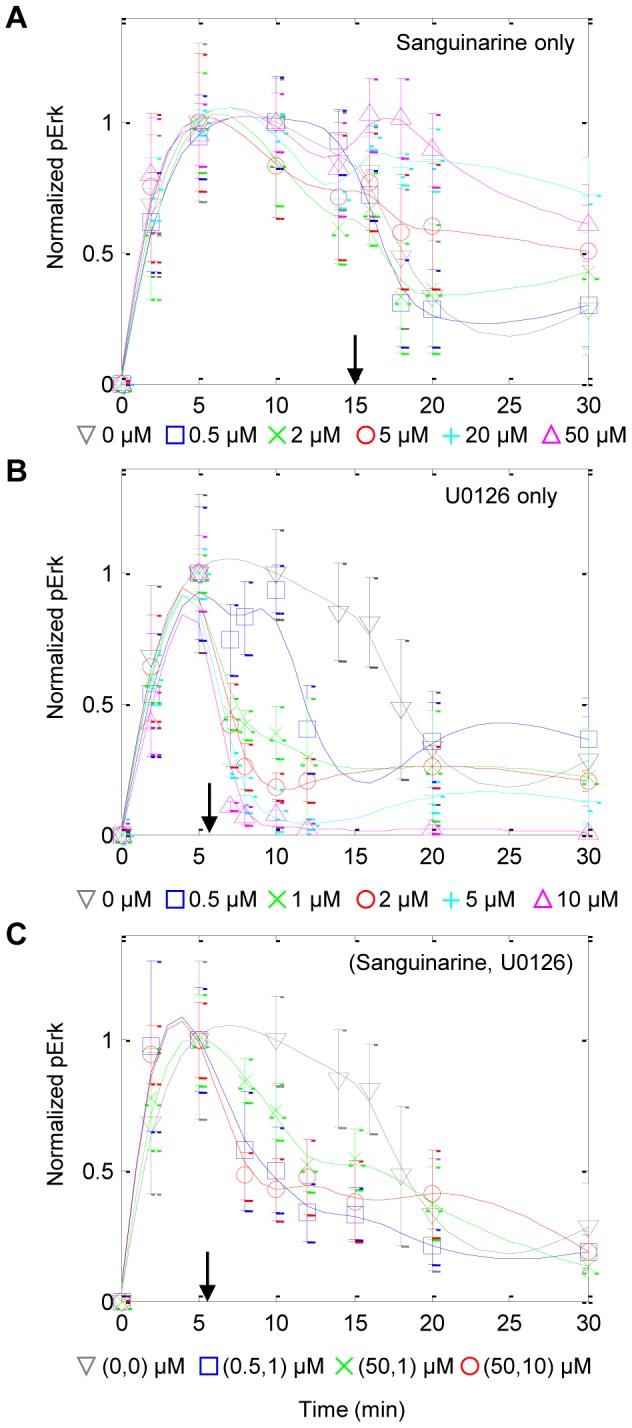
Rows correspond to doses of sanguinarine only, U0126 only, and combinations of the two reagents, respectively. Symbols and error bars denote means ± standard errors of the raw normalized data. Lines represent smoothed data. Arrows denote the time at which the reagents were administered.