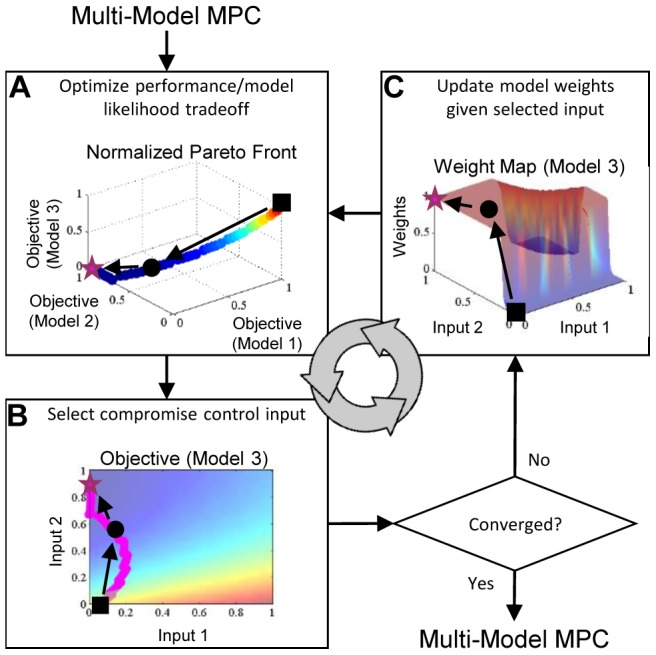
Figure 9. Illustration of control input selection with model weight adaptation.

For a given prediction time interval in the control process, Pareto-optimal control inputs are computed by the multi-model MPC strategy by solving (7), which then enter an iterative process of control input selection and weight adaptation. (A) First, Pareto points are ranked with an initial weight vector ω0 and the optimal point (example: black square) is selected using (8). (B) Next, the input vector corresponding to the selected optimal point (u 1, black square) is identified. If the input vector continues to change above a pre-defined threshold, the process continues to the next iteration. (C) Given the current input vector (u 1), a new weight vector (ω(u 1), black square) is computed. The process continues and repeats (example: black circle, then magenta star) until the aforementioned stopping criterion is met. The final input vector (un, magenta star) is returned to the main control loop as the best compromise control strategy and used to update the prediction models in preparation for the next prediction time interval.
