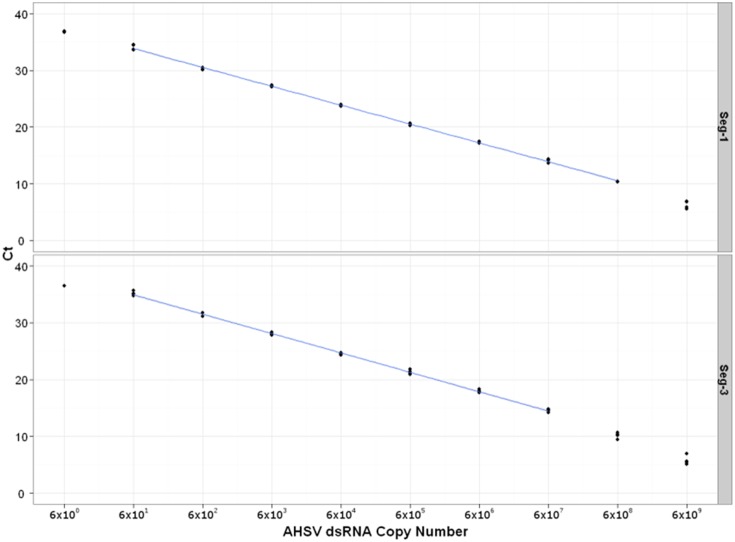
Figure 2. Standard curves for Ct value against RNA copy number for Seg-1 and Seg-3 RT-PCR.
Standard curves generated by plotting Ct values against corresponding log copy number of viral dsRNA (RSArah01/03) in Seg-1 and Seg-3 assays. Each dilution was tested in quadruplicate. Non-linearity of the lowest and highest dilutions were excluded from the analysis.

