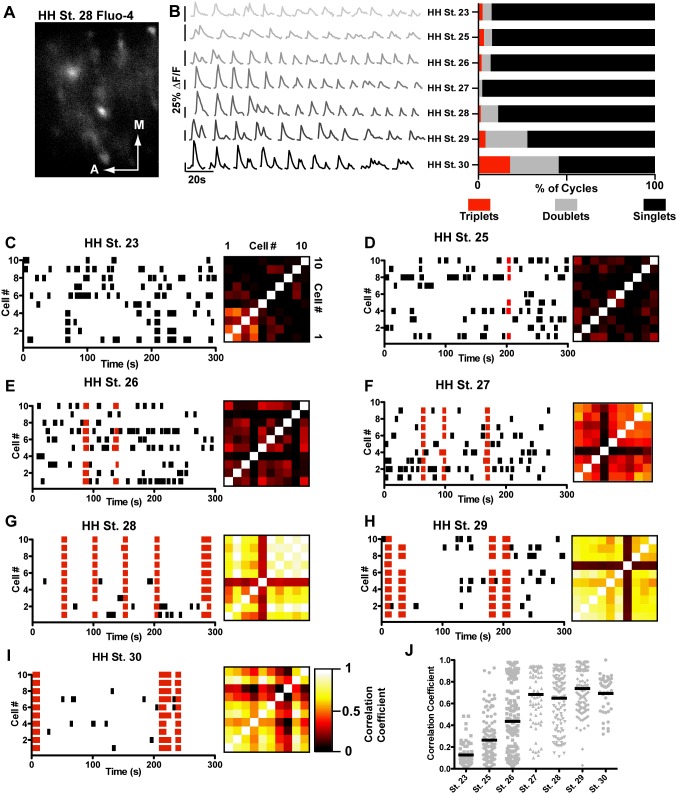
Figure 6. Synchronized activity develops over time.
A) Example of a field of view from an HH St. 28 embryo containing fluo-4 labelled motor neurons (red dotted regions, scale bar = 100 μM). B) Examples of calcium traces from single cells through development; cycles become less variable over time, and regularly fire in episodes of multiple cycles. C–I) Raster plots and correlograms of activity in populations of cells between HH St. 23 and HH St. 30. Black bars indicate uncorrelated cycles, in which <60% of the motor neurons in the field of view participate, red bars indicate correlated cycles, in which >60% of motor neurons participate. The firing pattern of neurons is initially apparently random, becoming more synchronous with time such that by HH St. 28, very few cycles occur in an asynchronous fashion. Similarity of activity patterns between two given neurons is represented by black-framed correlograms that increase in brightness over time, representing the increase correlation between cells. J) Mean correlation coefficient of neurons over time increases from HH St. 23 to HH St. 30, as the firing of individual neurons in the circuit becomes more synchronous.

