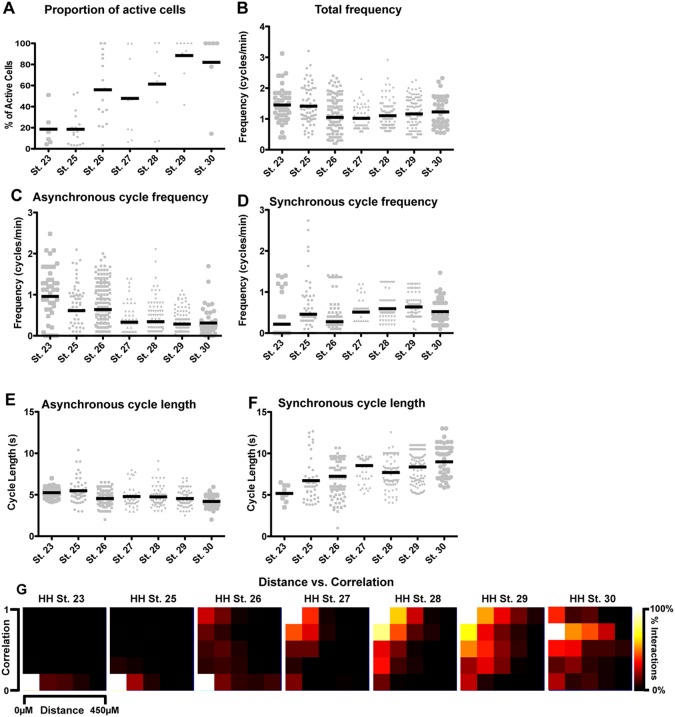
Figure 7. Variation in the synchronicity of activity with developmental age and neuron-neuron distance.
A) Over time, the percentage of active neurons in a preparation increases from 18.61%±7.19% to 81.01±14.02%; p<0.0001, one-way ANOVA. B) The frequency of motor neuron firing shows significant changes over time, decreasing moderately from HH St. 23 to HH St. 30. C) There is a decrease in the frequency of asynchronous cycles over time counteracted by only a small increase in the frequency of synchronous cycles (D). E) The length of asynchronous cycles decreases, whilst the length of synchronous cycles increases over time (F). G) Analysis of the distance between two given cells and the correlation between them shows that embryos at HH St. 23 and HH St. 25 are dominated by asynchronous cycles, but that older embryos have higher synchronicity over longer distances. Pixel intensity indicates the percentage of interactions at a given correlation and distance.

