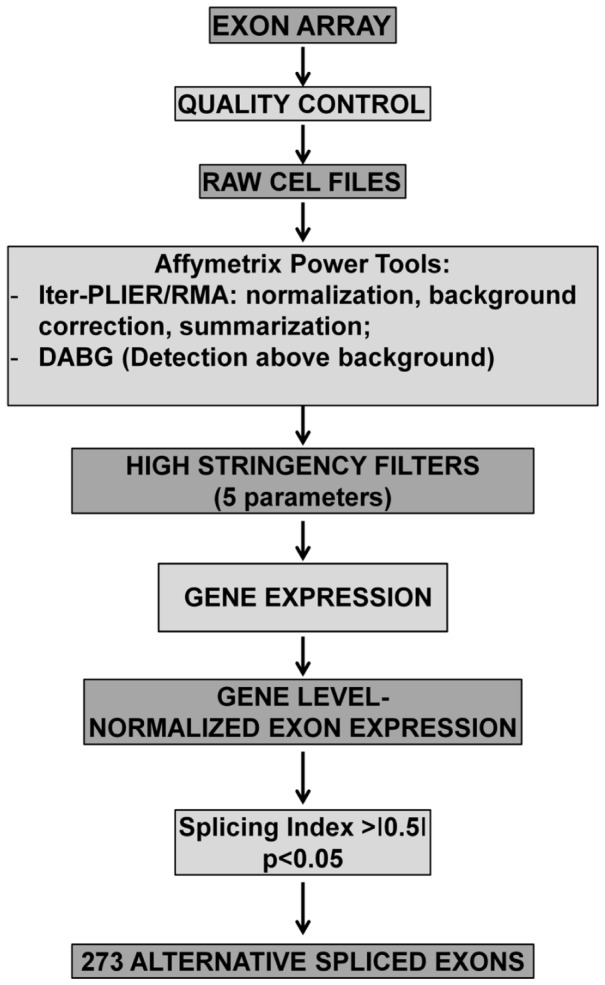
Figure 1. Array analysis workflow for AS identification.

The scanning of hybridized GeneChip Human Exon 1.0 ST Affymetrix microarrays, after quality control, generated raw CEL files. These were uploaded on Exon Array Analyzer and processed by Affymetrix Power Tools (APT). Iter-PLIER and RMA performed a data pre-processing, while DABG calculated p-values to indicate if the exon signal was detected within or above the background noise. Next gene expression, gene level normalized exon expression, splicing index were calculated. Only events with a p value<0.05 and a splicing index <-0.5 or >+0.5 were considered. Next, 5 further selection criteria were applied in order to minimize the number of false positives (see Methods). This analysis yielded 273 alternative spliced exons in DM2 patients.
