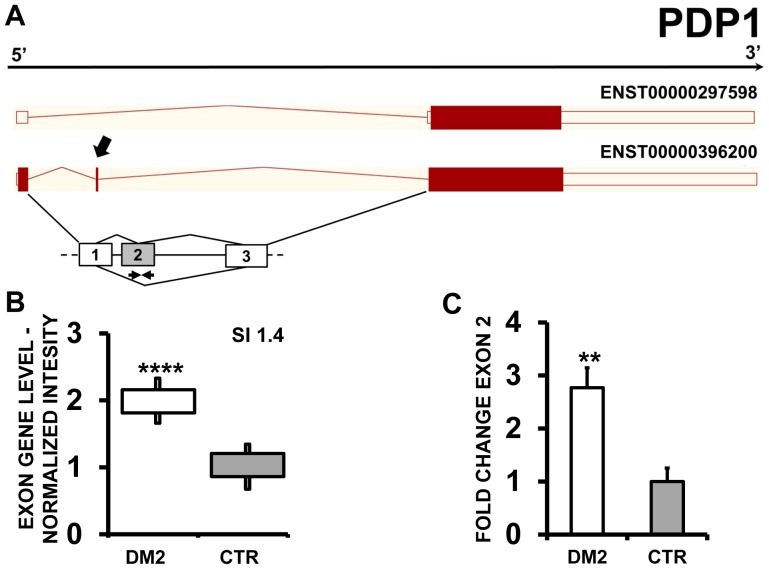
Figure 8. Increased PDP1 exon 2 inclusion in DM2 patients.
A) EAA analysis identified an AS event on exon 2 of PDP1 mRNA transcript ENST00000396200. The AS area is enlarged and exon 2, more frequently included in DM2 patients, is highlighted in solid gray. B) The box plot shows the increased expression of Affymetrix probe set 3107346 recognizing exon 2, in DM2 patients compared to CTR (n = 10, **** p<0.0001). Values are normalized for the levels of the whole transcript. The splice index (SI) is indicated. C) Validation qPCR assays were performed using the specific primer pair indicated as black arrowhead in panel A. Results are shown as fold change (DM2 = 19, CTR = 15; ** p<0.01).

