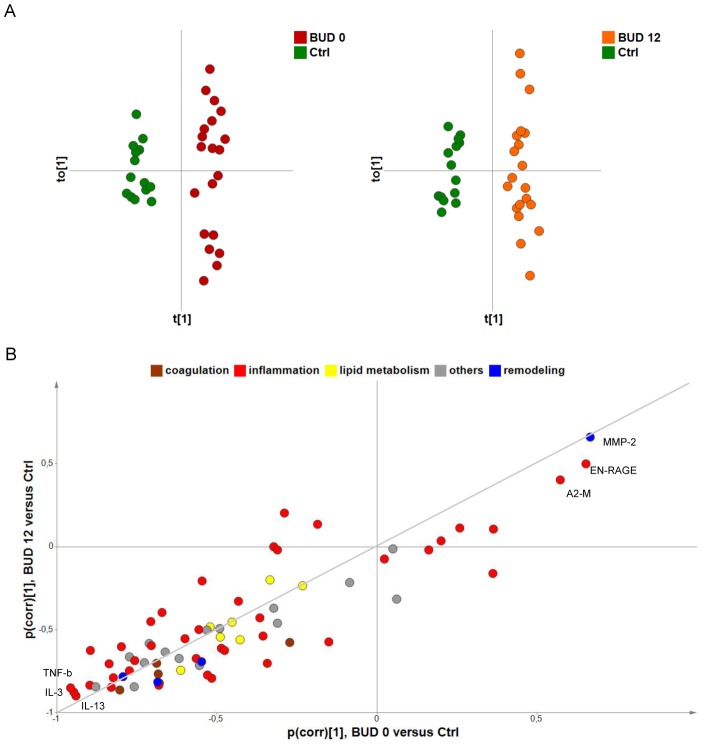
Figure 2. Suppression of multiple serum proteins in patients with BUD.
A) O-PLS-DA of serum protein levels in healthy donors (Ctrl) versus BUD patients at week 0 (BUD 0, left) or week 12 (BUD 12, right). Score plots displaying predictive t[1] versus orthogonal tO[1] components are shown, with 95% confidence ellipses (based on Hotelling's T2 statistic) showing the absence of outliers. B) SUS-plot resulting from these O-PLS-DA models. Variables situated along the indicated diagonal are comparably modulated in BUD 0 and BUD 12, compared to Ctrl. The more reliable (pcorr[1] close to −1 and +1) are labelled.

