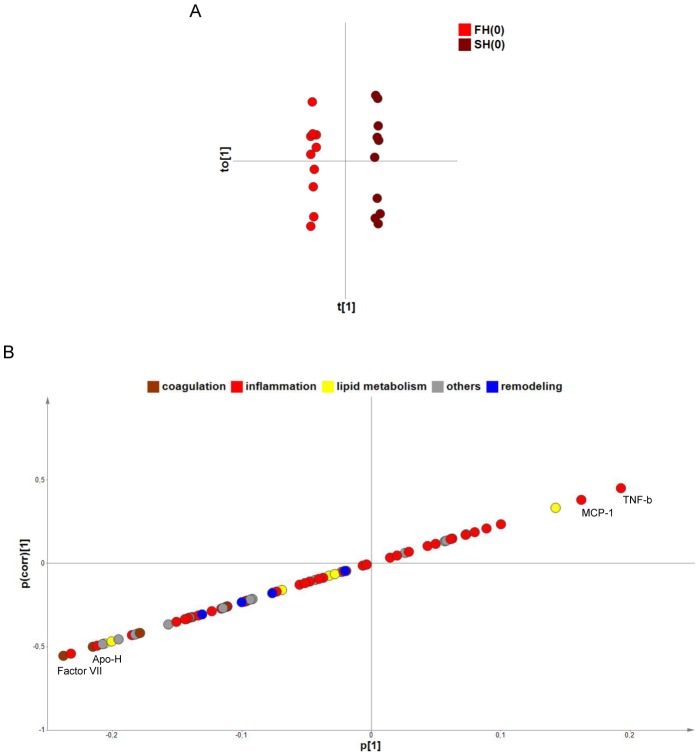
Figure 6. Differential protein signature in fast and slow healers.
A) O-PLS-DA of serum protein levels in fast and slow healers, before the beginning of antibiotic therapy. The score plot for this model (predictive t[1] versus orthogonal tO[1]) with a 95% confidence ellipse are shown. B) S-plot illustrating the modelled covariance (p[1]-axis) and correlation (pcorr[1]-axis) of variables in FH and SH. The p[1]-axis describes the magnitude of each variable, while the pcorr[1]-axis represents the reliability of each variable (between +/−1). The most discriminating variables, at both extremities of the X-Y diagonal, are labelled.

