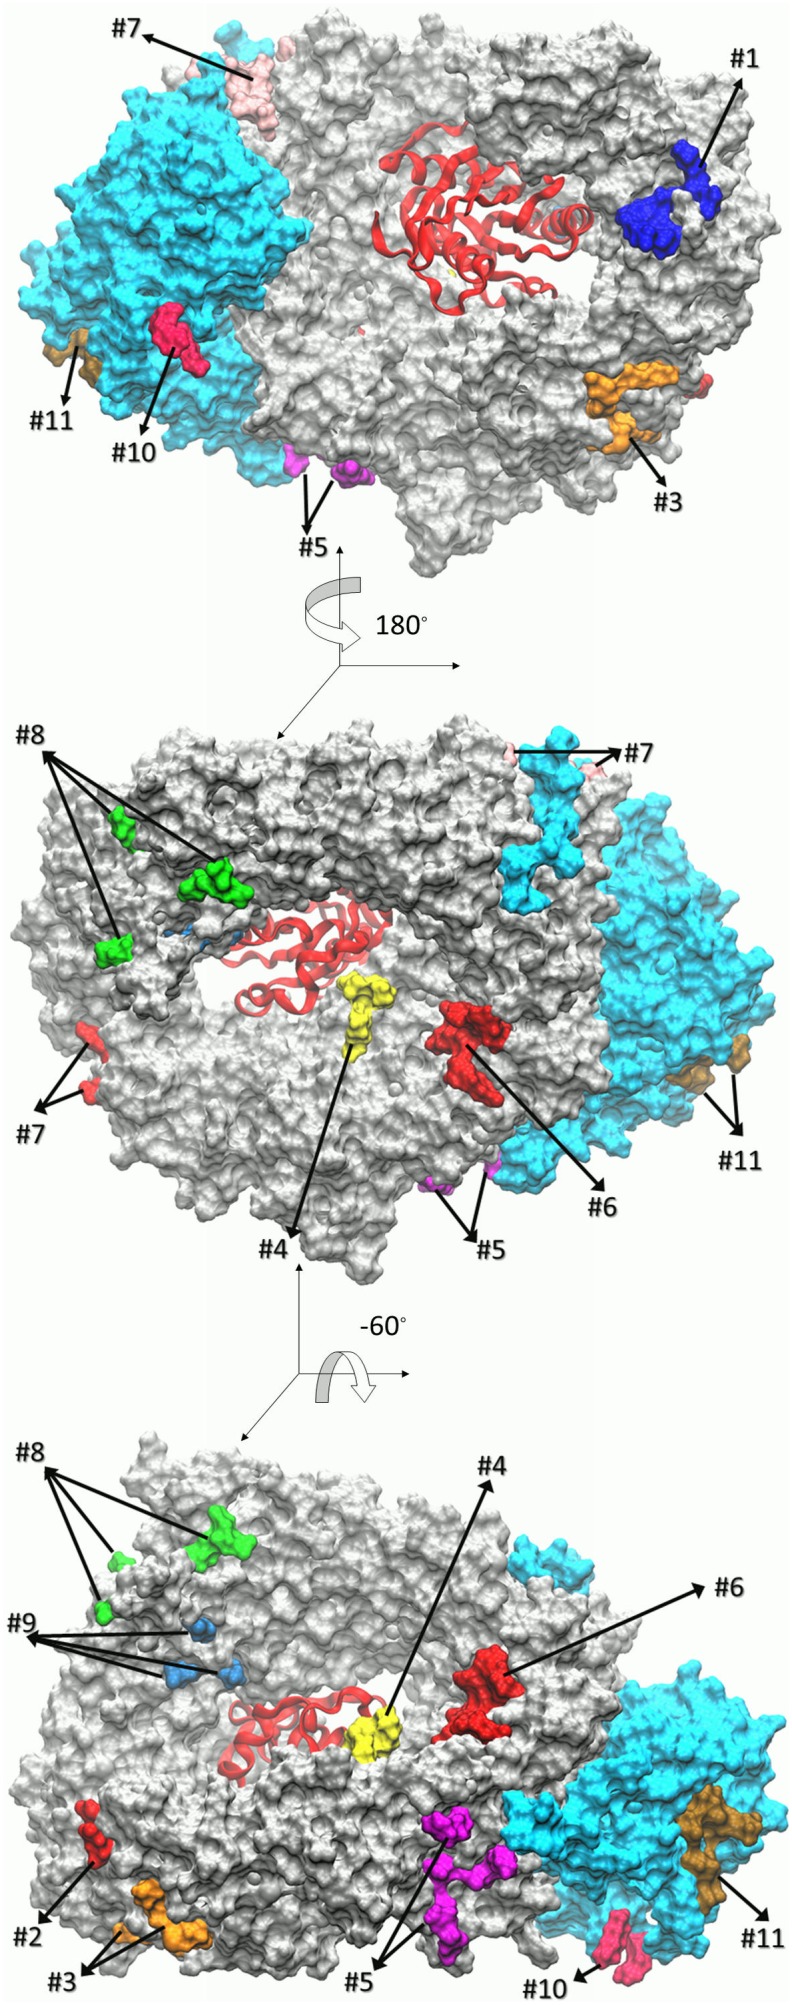
Figure 2. Location of C-Tpr binding sites on CRM1 (silver) and Snurportin (cyan) based on the collective results of two 200 ns-long simulations.

(A) Solvent accessible representation of CRM1-RanGTP-Snurportin complex. Binding sites are numbered according to their position in the amino acid sequence (see Table 1) with different colors. RanGTP is shown as a red ribbon. (B) Angle of view is rotated 180° about the vertical axis. (C) Angle of view rotated −60° about the horizontal axis.
