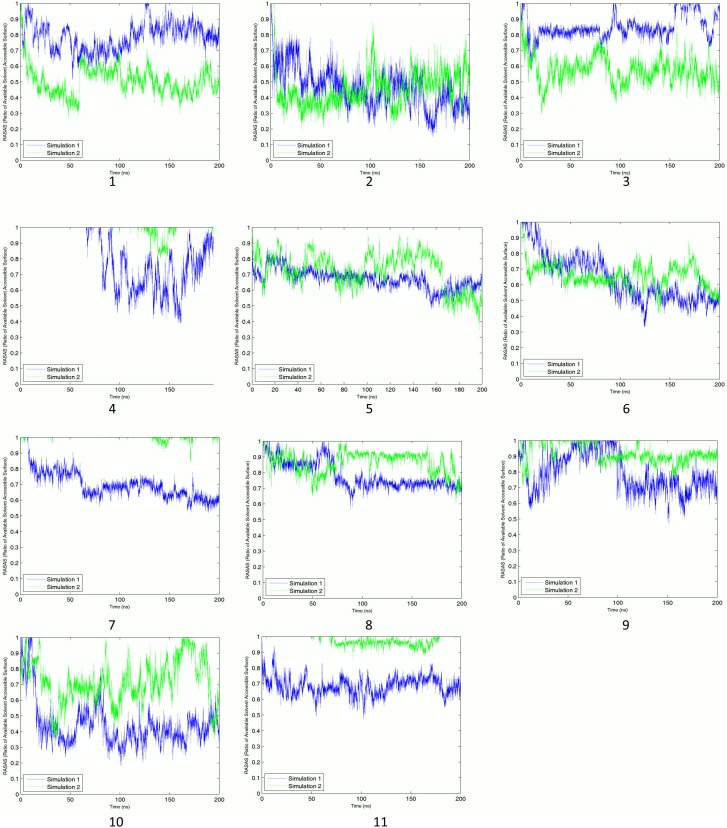
Figure 5. Ratios of available solvent accessible area (RASAS) for binding sites.
Binding site number appears under each graph. Graphs for simulations 1 and 2 are plotted in blue and green lines, respectively. Although the nature of RASAS is completely different from the interaction energy, they are generally in agreement, building confidence in the results.

