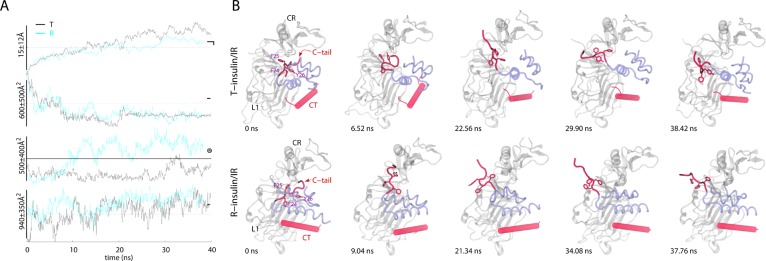
Figure 2.

TAMD-generated conformational change in the C-terminus of the B-chain of each insulin. (A) Traces (T-insulin, black; R-insulin, cyan) of the root-mean-squared deviation (RMSD) and buried surface area (BSA) versus simulation time (ns) are shown for each insulin/IRΔβ complex. Circled digits indicate the following: (①) RMSD of the C-terminus (residue B21–B30) of the B-chain of each insulin. For RMSD computation, the insulin molecules were aligned based upon the residues of each A- and B-chain (A1–A21 and B1–B20; Cα); (②) BSA between the C-terminus of the B-chain (residues B21–B30) of each insulin and rest of the insulin molecules; (③) BSA between each insulin molecule (except the B-chain residues B21–B30) and the L1 domain; and (④) BSA between CT and the L1 domain. Horizontal lines indicate the values measured in the IRΔβ crystal structure (PDB code 3LOH) except the dotted horizontal lines that are arbitrarily drawn for guidance. (B) Conformational change in the C-terminus of the B-chain of each insulin is highlighted. Representative snapshots of each insulin (transparent blue), CT (transparent red), and the L1 and CR domains of IRΔβ (transparent white) are shown at various time-points of respective TAMD simulations. The residues FB24, FB25, and YB26 are shown in sticks and labeled in the first snapshot for each insulin/IRΔβ complex. Initial positions of CT are different (from the crystal structure) for each insulin/IRΔβ complex because TAMD trajectories were started based upon the Monte Carlo (MC) docked and MD-equilibrated structural models of each insulin/IRΔβ complex. Some of the terminal residues of CT spontaneously fold/unfold during TAMD trajectories. Adapted with permission from ref (169). Copyright 2013 John Wiley & Sons, Inc.
