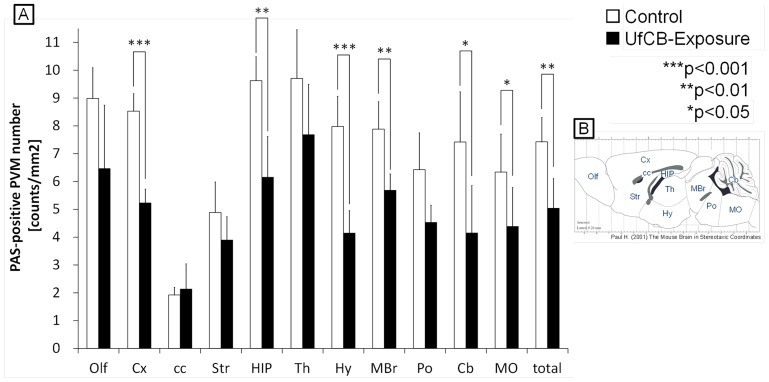
Figure 4. Quantitative observation of PAS-positive PVMs.
A: The number of PAS-positive PVMs in each brain region (n = 5/group). Numbers in the following regions were significantly decreased in UfCB-exposed offspring; cerebral cortex (Cx), hippocampus (HIP), hypothalamus (Hy), midbrain (MBr), cerebellum (Cb), and medulla oblongata (MO). Asterisks indicate statistical significance (* P<0.05, **P<0.01, ***P<0.001). Data are shown as mean ±SD. B: The regions of the brain. Abbreviations: Olf, olfactory bulb; Cx, cerebral cortex; cc, corpus callosum; Str, striatum; HIP, hippocampus; Th, thalamus; Hy, hypothalamus; MBr, midbrain; Po, pons; Cb, cerebellum; MO, medulla oblongata.

