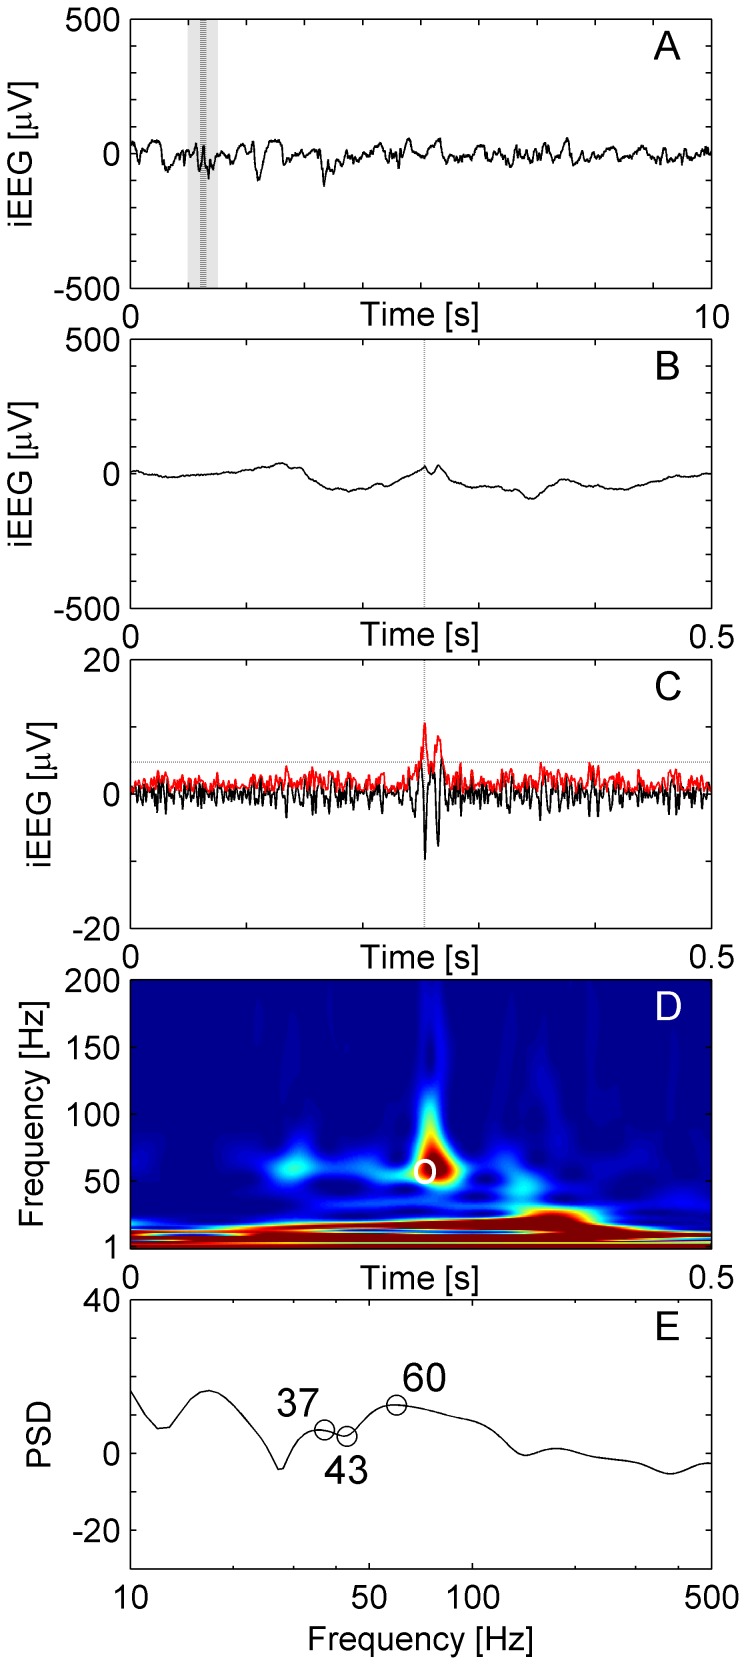
Figure 4. HFO with frequency peak below 80 Hz.
(A) Raw iEEG data 10 s epoch from channel HL6 in patient 1. (B) Raw iEEG at extended time scale of 500 ms. (C) Filtered iEEG with envelope (red line). The envelope satisfies the criteria for an EoI (Stage 1 of detection). The EoI is salient enough to be separated from low-frequency activity by a trough (D, E). This EoI has the visual appearance of a HFO but the peak frequency is around 60 Hz. Therefore, in Stage 2 the lowest boundary for a HiFP was chosen at 60 Hz and this EoI was accepted as HFO by our detector.

