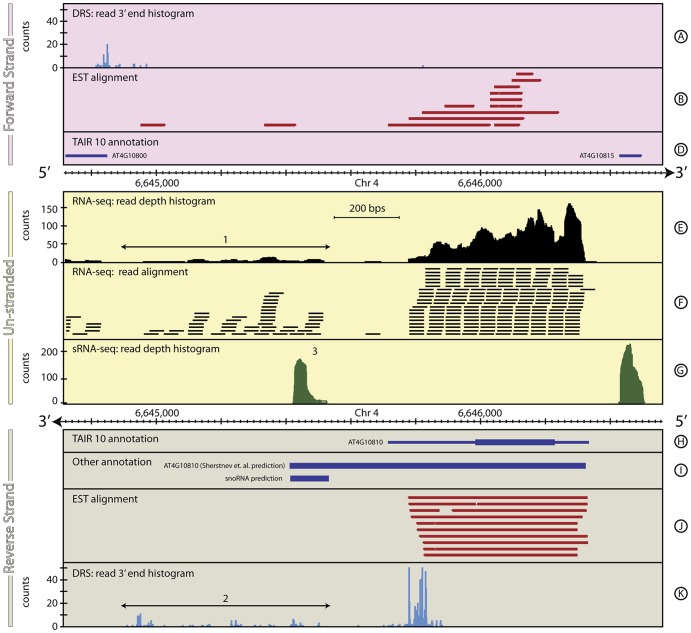
Figure 9. The genomic context around AT4G10810 in A. thaliana.
This figure shows a ∼2 kb region of A. thaliana, chromosome 4, including AT4G10810 that demonstrates the capability of combined DRS, RNA-seq and sRNA-seq to identify novel genes. This also highlights some of the limitations of automated re-annotation algorithms that are based on arbitrarily chosen parameter values. In this case, [19] (2012), provide a re-annotation of the 3′ UTR of AT4G10810 by focussing on the DRS data within a region 300 bp downstream of the end of the primary database annotations (Track K). For most A. thaliana genes, this proves to be an effective strategy, but occasionally it results in incorrect re-annotations. Here, the region downstream of AT4G10810 encompasses multiple relatively weak DRS peaks (Track K, 2) and Sherstnev et al mistakenly re-annotate the gene to include many of these peaks (Track I). In fact, the RNA-seq data (Tracks E & F, 1) clearly identify the spatial separation between AT4G10810 and the significant low-level downstream expression, suggesting a novel gene, or cluster of genes. Interestingly, a strong peak in the sRNA-seq data in this region (Track G, 3), coupled with a coincident prediction from SnoSeeker (Track I), strongly suggests the presence of a novel snoRNA in this region. See the Materials and Methods section for more details on the generation and processing of the A. thaliana RNA-seq, sRNA-seq, EST and DRS datasets.

